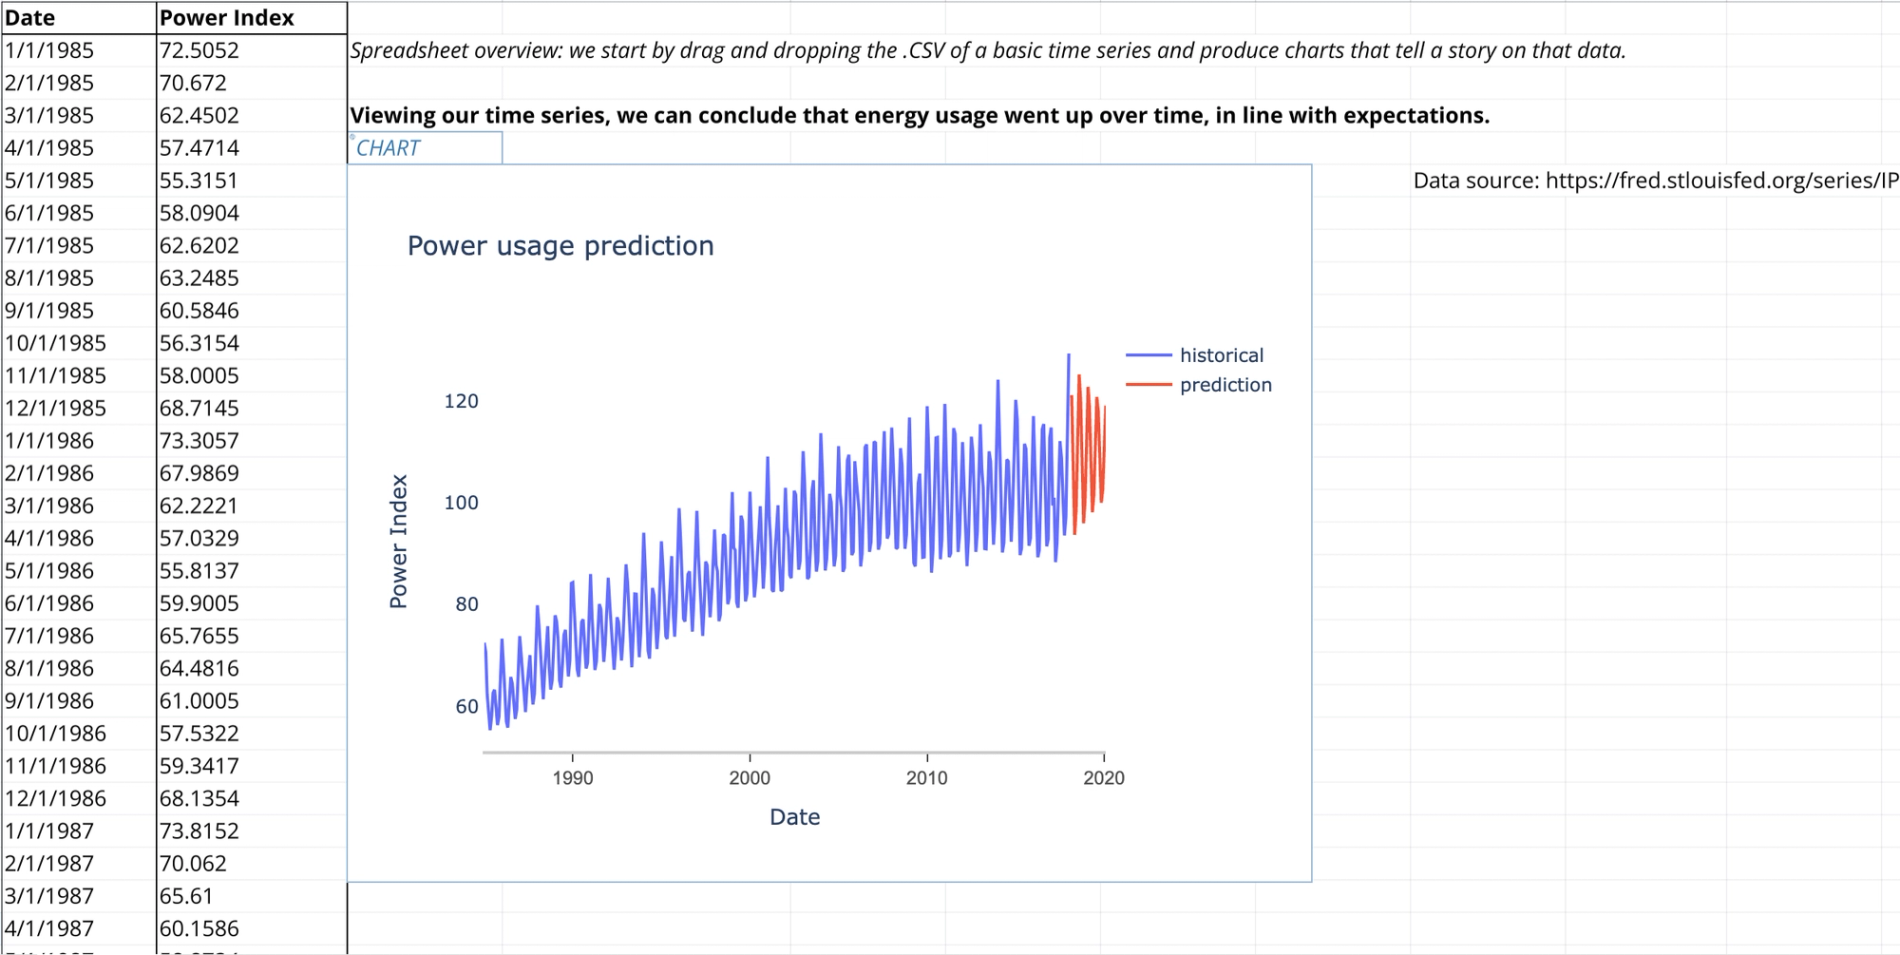
Transform raw energy data into actionable insights with our predict energy usage template. This ready-to-use spreadsheet helps analysts, facility managers, and sustainability teams visualize historical power consumption patterns and forecast future energy needs.
What's Inside:
- Pre-formatted time series analysis structure
- Interactive power index visualization
- Built-in Python plotting capabilities
- Sample data from 1985 onwards to demonstrate functionality
Perfect For:
- Energy analysts tracking consumption patterns
- Facility managers planning resource allocation
- Sustainability teams monitoring usage trends
- Operations managers forecasting utility costs
- Business planners developing energy strategies
How It Works:
- Import your energy consumption data directly into the template
- Watch as the built-in visualizations automatically update
- Leverage Python-powered charts for deeper analysis
- Extract insights from historical patterns
- Share compelling visual reports with stakeholders
Key Features:
- Clean, professional data structure
- Automated time series visualization
- Python integration for advanced analytics
- Historical trend analysis
- Easy-to-understand power index tracking
Who Benefits
Whether you're an energy consultant analyzing client usage patterns, a facility manager tracking consumption trends, or a sustainability officer monitoring environmental impact, this template streamlines your workflow and enhances decision-making capabilities.
Why Choose This Template:
- No complex setup required
- Professional-grade analytics
- Built-in data visualization
- Seamless Python integration
- Ready for immediate use
Start transforming your energy data into actionable insights today. Simply duplicate the template and begin your journey toward more informed energy management decisions.


