Modern spreadsheet with Python, SQL, & AI

Analyze data the developer way. Share results the spreadsheet way.

Create spreadsheet
Screenshot of Quadratic

The familiarity of a spreadsheet + the power of AI.

You already know how to use a spreadsheet, and AI knows how to analyze your data. Now you can get more done faster.

Stylzied screenshot from Quadratic showing a list of languages the user can choose from when populating a cell, including: Formulas, Python, SQL queries, and JavaScript (the latter two are disabled and labeled as “Coming soon”).

Cells backed by code

Use the languages you and your team already know. Quadratic understands Formulas, Python, JavaScript, and SQL.

Learn more

A SQL query with an arrow being drawn to a number of cells with data representing the output of that SQL query.

SQL queries

Pull data directly from your database or data warehouse.

Learn more

Some sample code from pandas and numpy (Python) with an arrow showing how the result fro the last line of code gets drawn to a number of cells on a Quadratic spreadsheet.

Add data programmatically

The last line of code is returned to the spreadsheet. Raw values, 1/2D arrays, and Pandas DataFrames are supported by default.

Learn more

Code screenshot of importing and using a 3rd party python library in Quadratic, with an arrow showing where the library’s code output is drawn to the spreadsheet.

3rd party libraries

Quadratic has Python library support built-in. Bring the latest open source tools directly to your spreadsheet.

Learn more

A spreadsheet with numbers in cells and, overlaying that, a chart with points and a plotline.

Data visualizations

Create dynamic charts and graphs using popular Python charting library Plotly.

Learn more

A spreadsheet of cells with a stock ticker as the input and, behind the scenes, code is fetching data related to that stock and drawing it in the cells underneath the ticker symbol.A spreadsheet of cells with a stock ticker as the input and, behind the scenes, code is fetching data related to that stock and drawing it in the cells underneath the ticker symbol.

Work with APIs

Pull or fetch data from an external API, and it updates automatically in Quadratic's cells.

Learn more

Two contrasting examples of the same code. The first is a long formula laid out on a single line which is really long and fades as you go left-to-right. The second is that same formula but formatted across multiple lines like you’d see in an IDE.

Multi-line formulas

Single-line formulas are hard to read. In Quadratic you can expand your formulas to as many lines as you need.

Learn more

The visual, interactive way to code with data.

Quickly write code and see the output in full detail. No more squinting into a tiny terminal to see your data output.

01234567891011121314
0ValuesTotal
1
220
330
440
550
6
7Latest stock price
8AAPL
9
10
11
12
13
14
15
1out = []
2
3for number in range(1,5):
4    out.append(number * 10)
5
6# Last value writes to the spreadsheet
7# in this case: [10,20,30,40,50]
8out

See more examples of using Quadratic

The world’s first canvas spreadsheet.

A structured spreadsheet that extends forever — you've never seen anything like this before.

Mac cursor

Pinch and zoom

Navigate with ease: zoom out for the big picture, zoom in to focus on the details.

Animated screen recording of a cursor dragging a CSV file over the spreadsheet grid in Quadratic and dropping the data in a specific cell which populates the grid with data from the file.

Drag ’n drop

Import with ease: grab a supported file type and drop it precisely where you want your data.
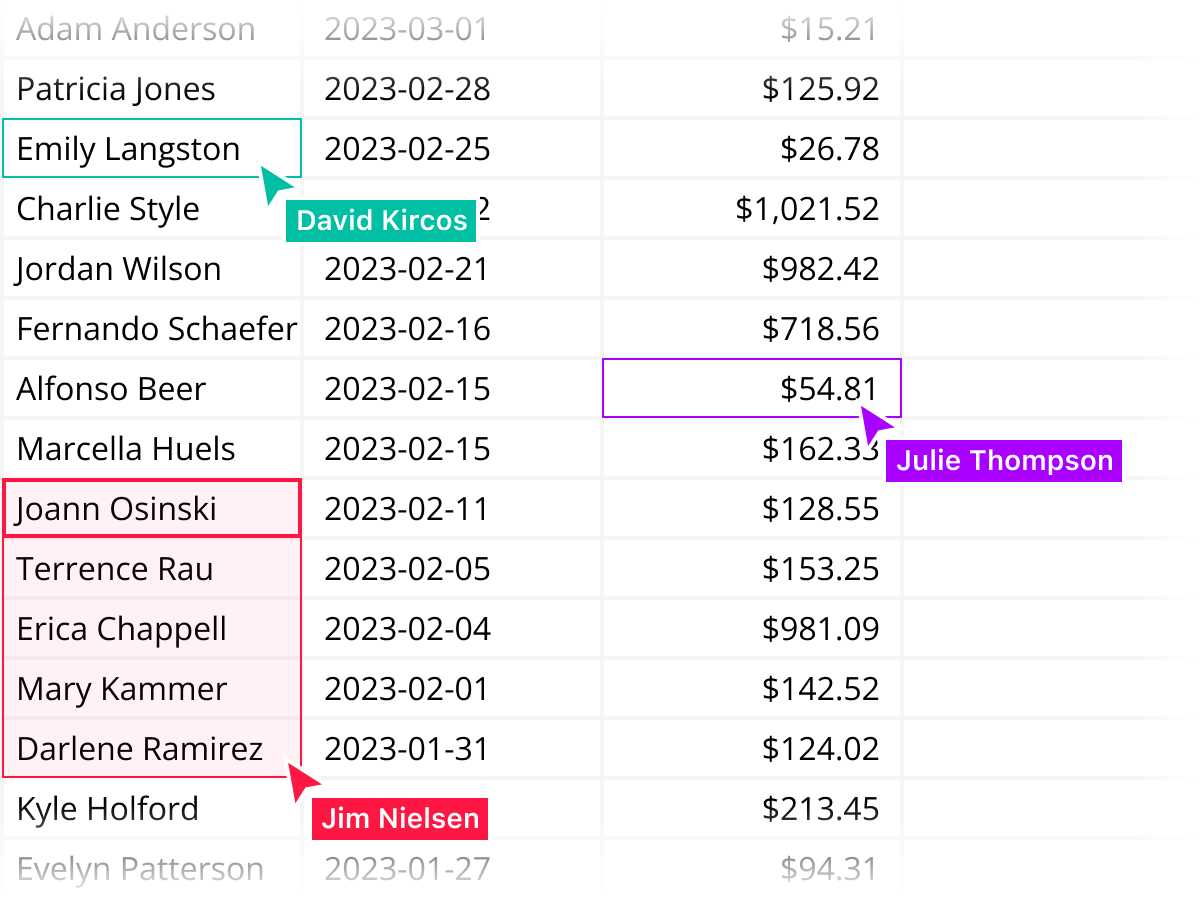
A number of cells populated with data and overlaid with multiple cell cursors, each with their own color and name indicating multiple collaborating on a single spreadsheet simultaneously.

Real time collaboration

Write code and share results instantly. If it works on your computer, it will work everywhere. See real-time mouse movements and collaborate on complex analyses.
Read our blog post

A spreadsheet with the Quadratic and OpenAI logos and a “+” in between them.
Experimental

Powerful AI integration

AI that can write and edit code, create charts, insert data, and so much more. Quadratic is a proud member of the Vercel AI Accelerator.

Learn more

Performance matters,
and so does your experience.

Quadratic is built for speed and comfort. Our goal is to make the tool disappear and enable you to get your work done fast.
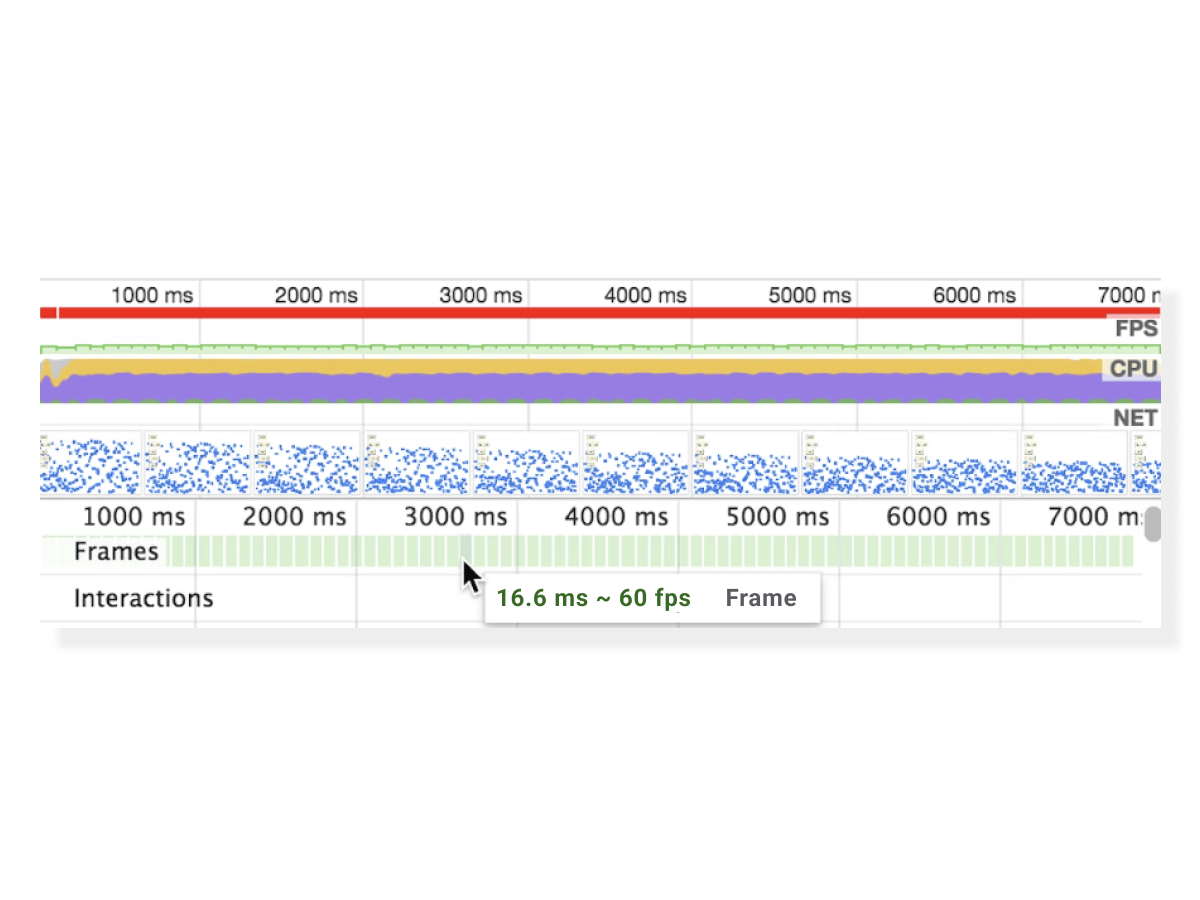
A screenshot of the performance tab in Chrome showing the framerate of Quadratic at 60fps.

Built like a video game

Designed to perform smoothly at 60 frames per second, our tool disappears and you can focus on what matters: working with your data.
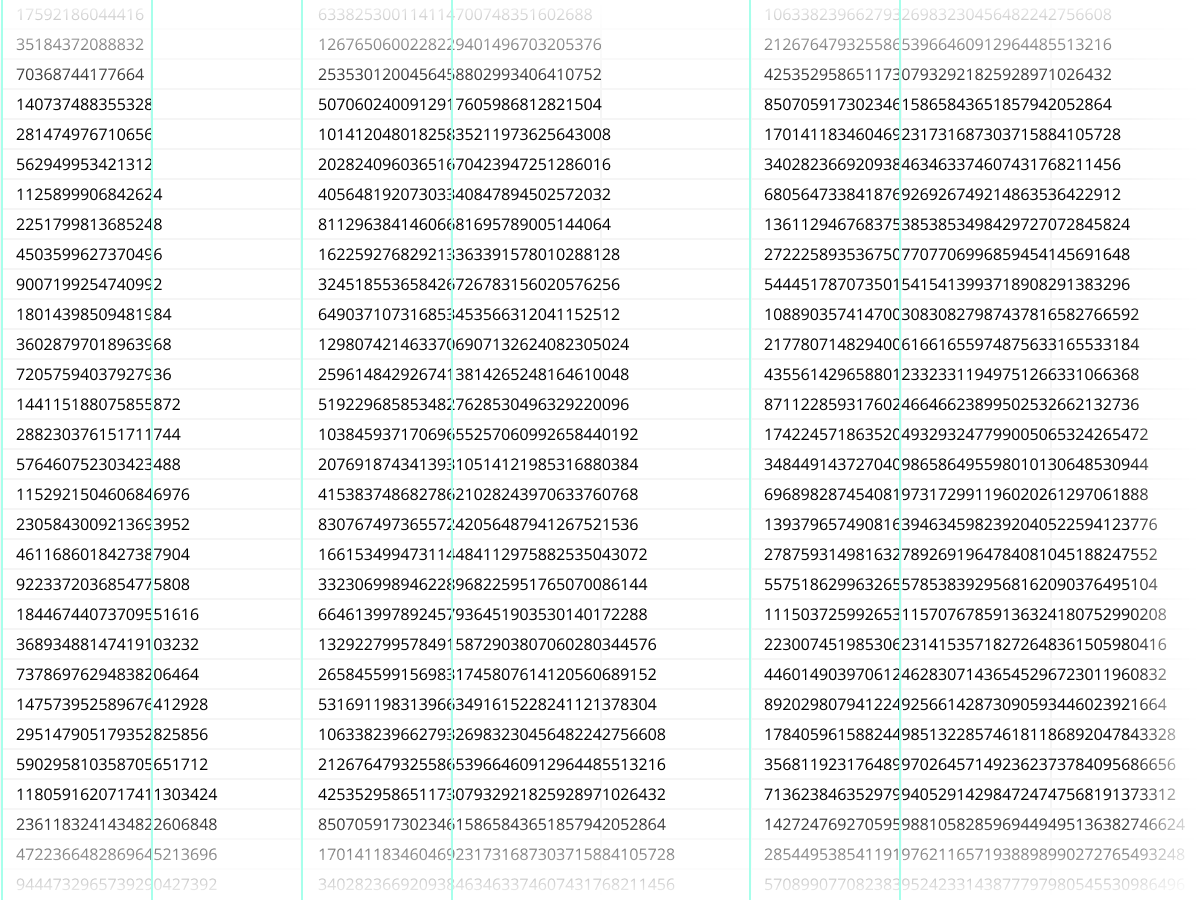
A giant list of prime numbers generated across many cells in a Quadratic spreadsheet.

Local data & computation

By default, data is stored and calculations run on your computer. Even large data sets and computations run in milliseconds.
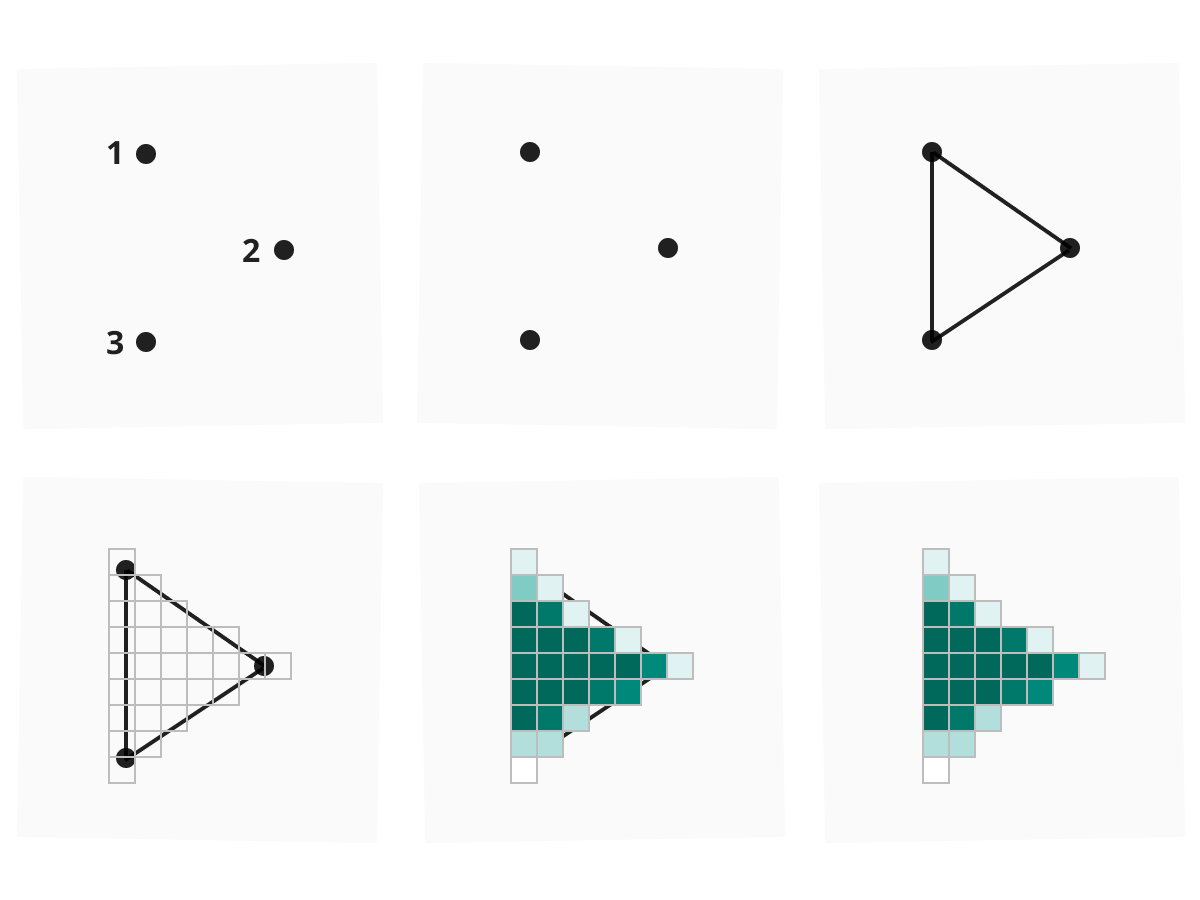
A graphic loosely illustrating how shaders work in WebGL.

Supercharged by Web Assembly and WebGL

Quadratic takes advantage of your CPU and GPU together to deliver a high performance spreadsheet.
Read our blog post

A picture of the Docker logo with the Docker command to host Quadratic underneath.

Self-hosting

Self-host Quadratic on your own infrastructure directly from our source available codebase.

Quadratic self-hosting portal

Quadratic logo

The spreadsheet with AI.

Use Quadratic for free