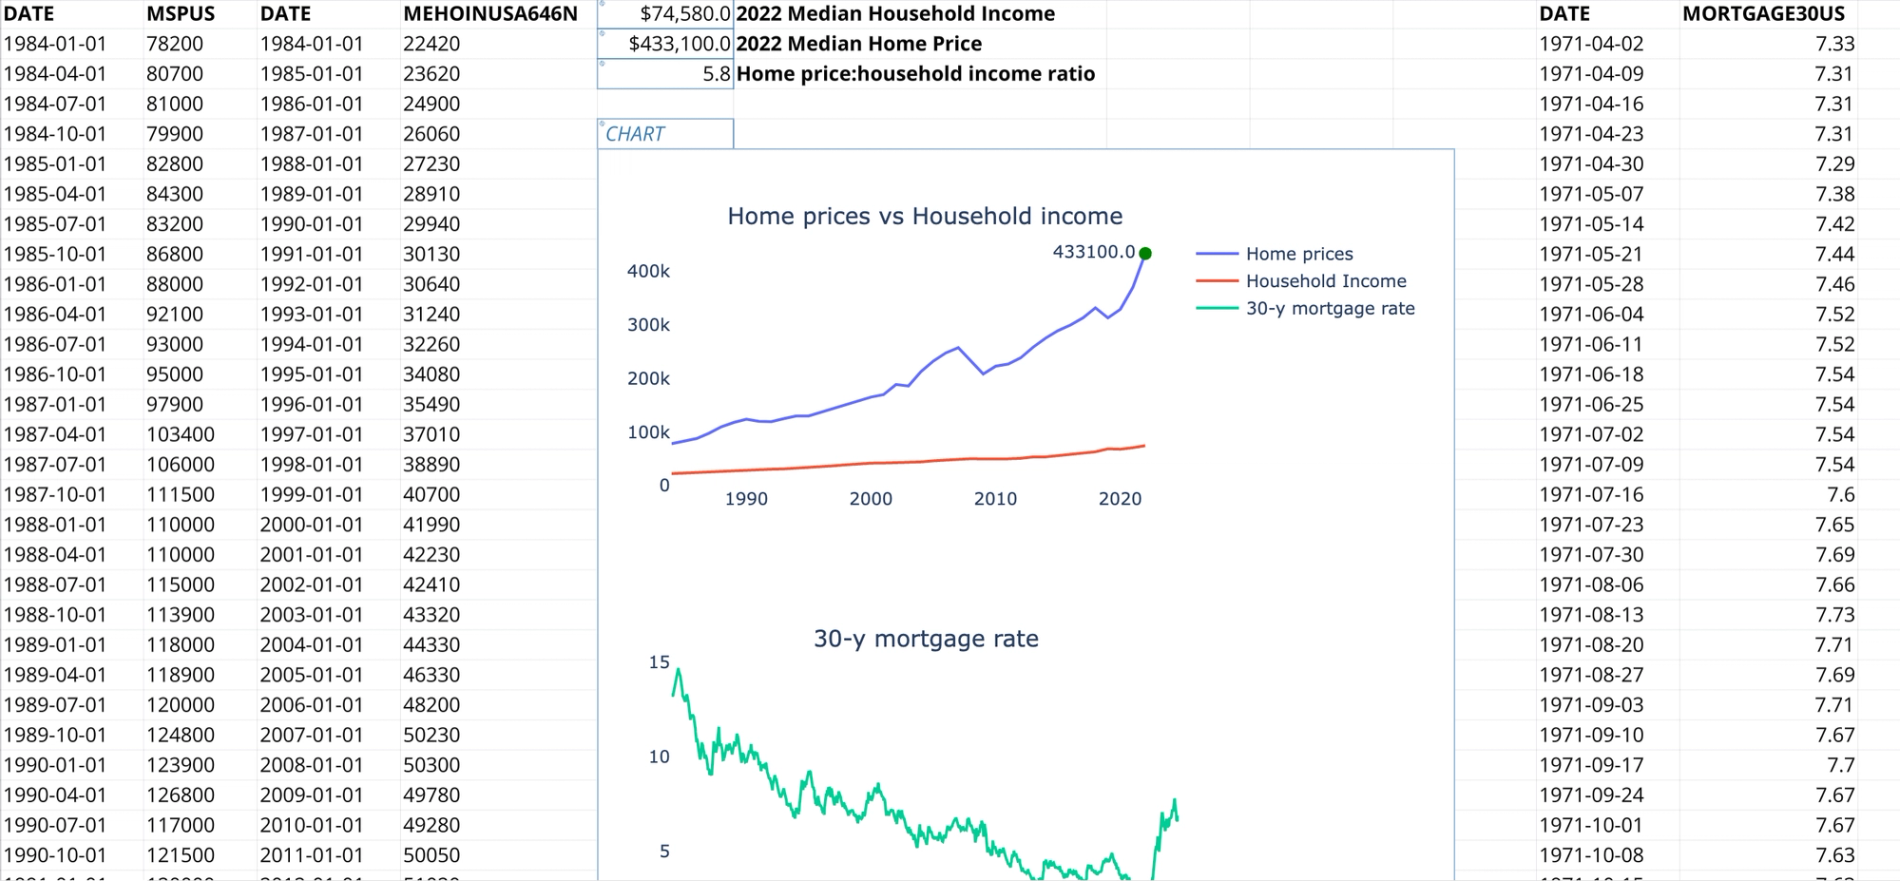
Make data-driven real estate decisions with our comprehensive housing market analysis template. This ready-to-use spreadsheet combines historical median home prices, household income data, and mortgage rates to provide deep insights into housing affordability trends.
Key Features:
- Historical median home price tracking (1984-present)
- Household income data correlation
- 30-year fixed mortgage rate trends
- Automated affordability ratio calculations
- Interactive data visualization capabilities
Perfect for:
- Real estate investors and analysts
- Housing market researchers
- Financial advisors
- Property developers
- Economic policy researchers
- Home buyers making informed decisions
How It Works:
- Access pre-loaded historical data from reliable sources
- View automatically calculated home price-to-income ratios
- Analyze mortgage rate trends over time
- Create custom visualizations using Python or built-in charting
- Add your data points for personalized analysis
What Sets This Template Apart:
- Clean, organized data structure
- Pre-built formulas and calculations
- Python-ready for advanced analysis
- Real-time data visualization options
- Flexible customization options
Whether researching market trends, planning investments, or analyzing housing affordability in different time periods, this template provides the foundation for thorough market analysis. The combination of historical price data, income metrics, and mortgage rates offers a complete picture of housing market dynamics.
Start analyzing housing market trends today with our user-friendly template. Experience the power of data-driven decision-making with Quadratic's interactive spreadsheet capabilities.


