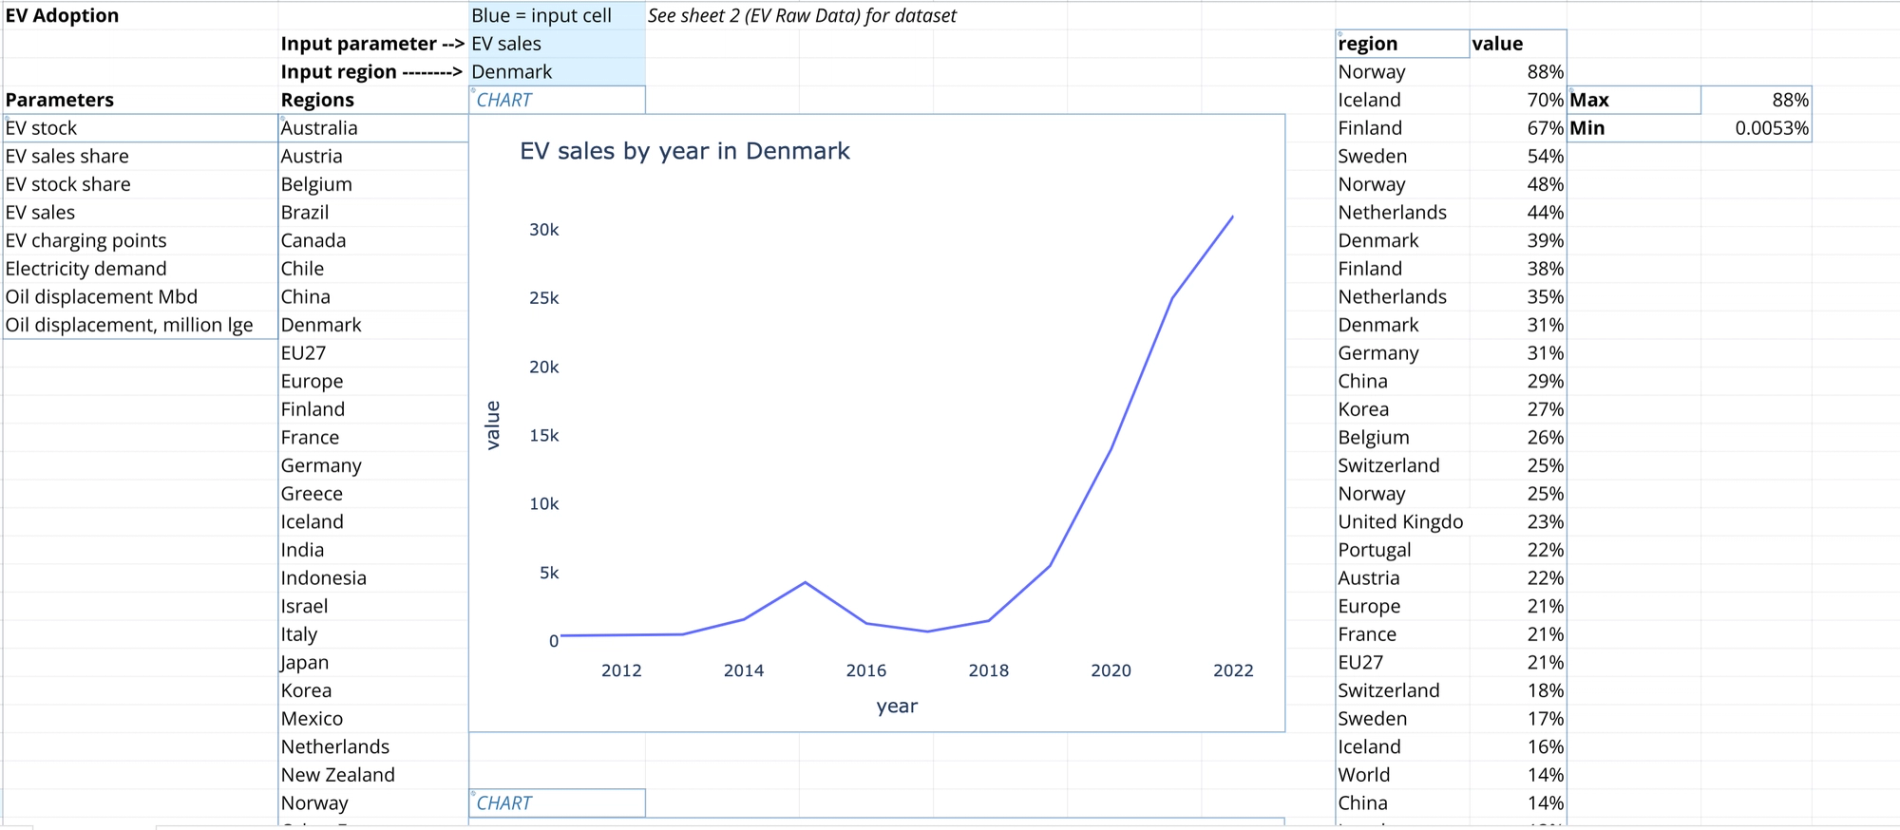
Transform raw EV data into actionable insights with our interactive Electric Vehicle Adoption Analysis template. This ready-to-use spreadsheet combines powerful data visualization with intuitive controls to help you understand EV market penetration across different regions.
Perfect for:
- Market researchers tracking EV adoption trends
- Automotive industry analysts
- Sustainability consultants
- Policymakers and urban planners
- Clean energy advocates
Key Features:
- Dynamic regional comparison dashboard
- Interactive parameter selection (EV sales, stock, and market share)
- Automated data visualization with Python-powered charts
- Min/max value tracking
- Cross-regional performance analysis
Getting Started:
- Select your analysis parameter (EV sales, stock, or market share)
- Choose a region to focus on
- Watch as the dashboard automatically updates with relevant metrics
- Compare performance across different territories
- Export insights for presentations or reports
What Sets This Template Apart
Built with Quadratic's unique capabilities, this template showcases the perfect blend of spreadsheet familiarity and advanced analytics. The built-in Python integration enables sophisticated data visualization while maintaining an accessible interface for users of all technical levels.
Real-World Applications:
- Track EV adoption rates across different markets
- Identify leading and lagging regions in electrification
- Monitor market share trends over time
- Support data-driven policy decisions
- Benchmark regional performance
Whether you're analyzing Norway's leading 88% EV market share or exploring emerging markets, this template provides the necessary analytical foundation. The intuitive design makes switching between different metrics and regions easy, ensuring you can focus on insights rather than setup.
Start analyzing EV adoption trends today with this professional-grade template. Experience the power of modern spreadsheet analytics with zero setup time – just open and start exploring your data.


