The shortest path to brilliant
product decisions
Build, validate, and share product analytics dashboards on live data so your team can ship faster with confidence.
Trusted by 250,000+ people at top companies and universities includingtop companies including
The best product managers make data-driven decisions with Quadratic
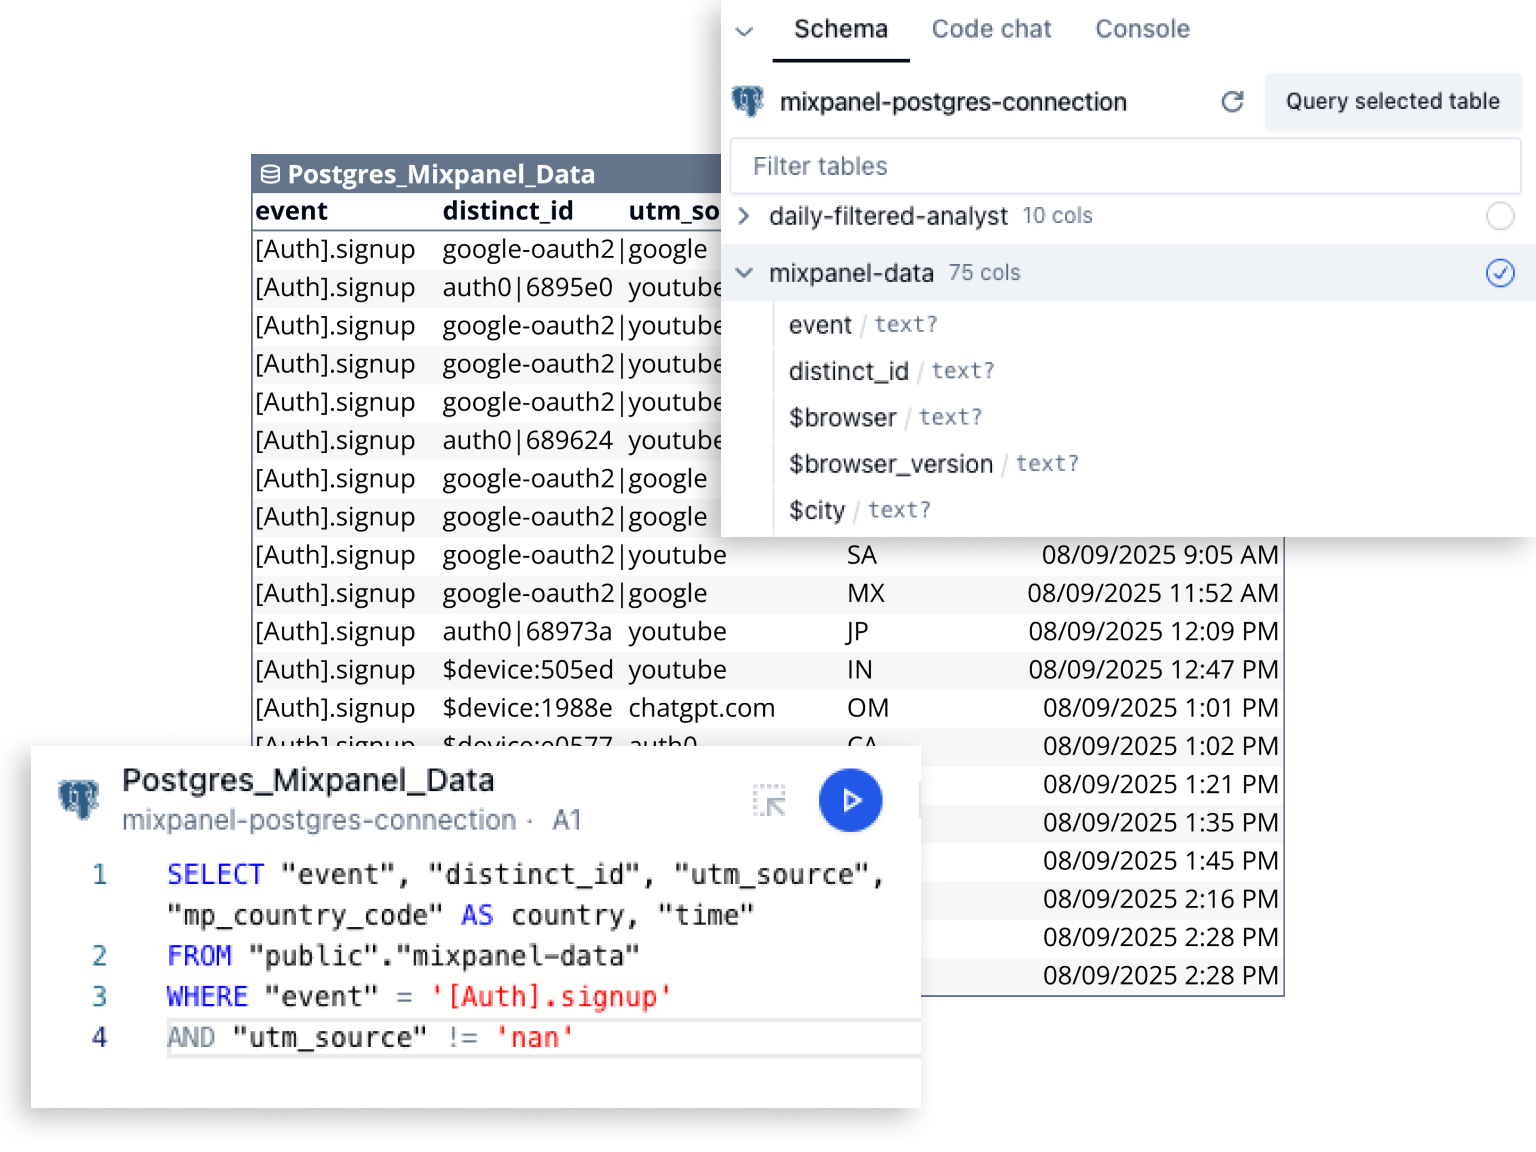
- Access your database safely without headaches
- Native AI that automates your entire workflow
- One place to explore, calculate, and visualize data
- Version history to keep analyses reproducible
- Refreshing charts so analysis stays close to live data
- SOC 2 and HIPAA compliant for enterprise-grade security
“Quadratic has become my go-to platform for working with our user data. I'm constantly using Quadratic to pull data sets on our user interactions to make better product decisions or to just test a new hypothesis. Quadratic has replaced 3 different tools and saves me a ton of time every week.”
Unlock live product data for product teams
Now your whole team can safely integrate to production databases to explore real usage, run their own analyses, and make decisions without waiting in a queue.
Get answers in minutes when it matters
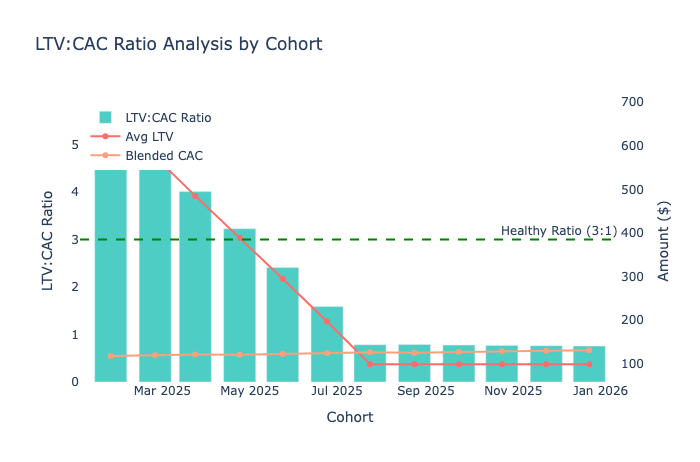
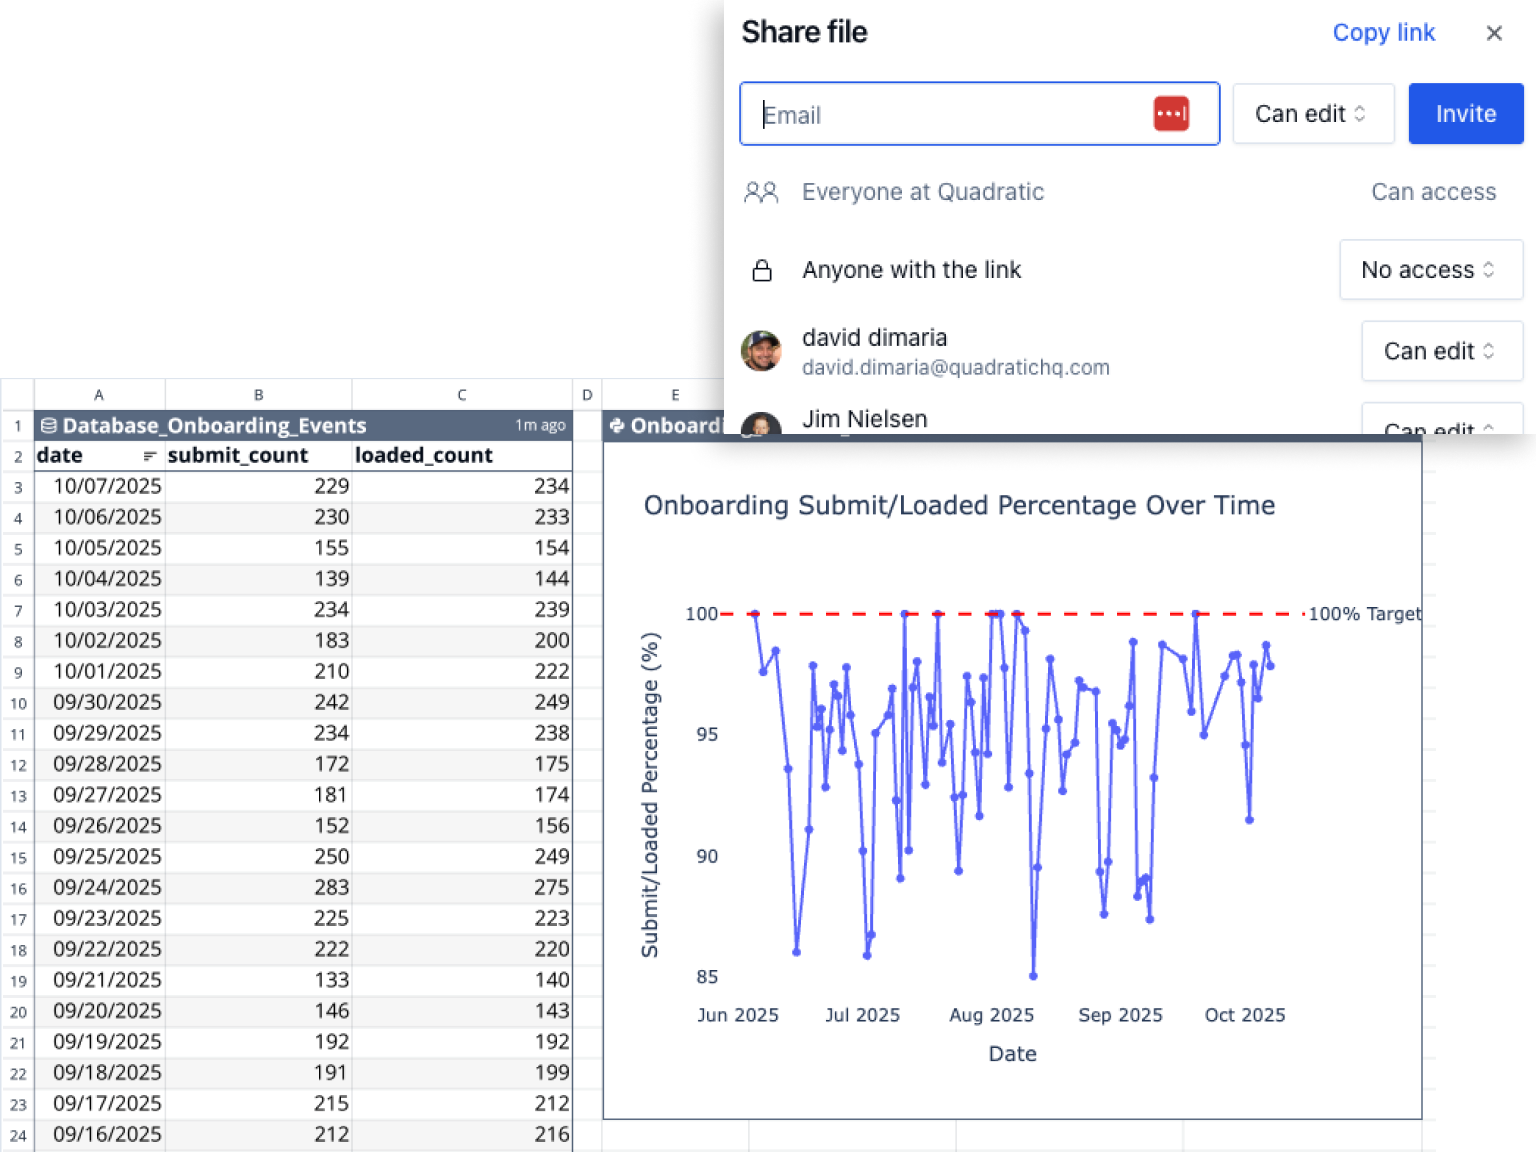
Move from question to chart quickly with AI-assisted queries and instant visualizations, so experiments ship on time and mid-sprint decisions stay grounded in actual behavior.
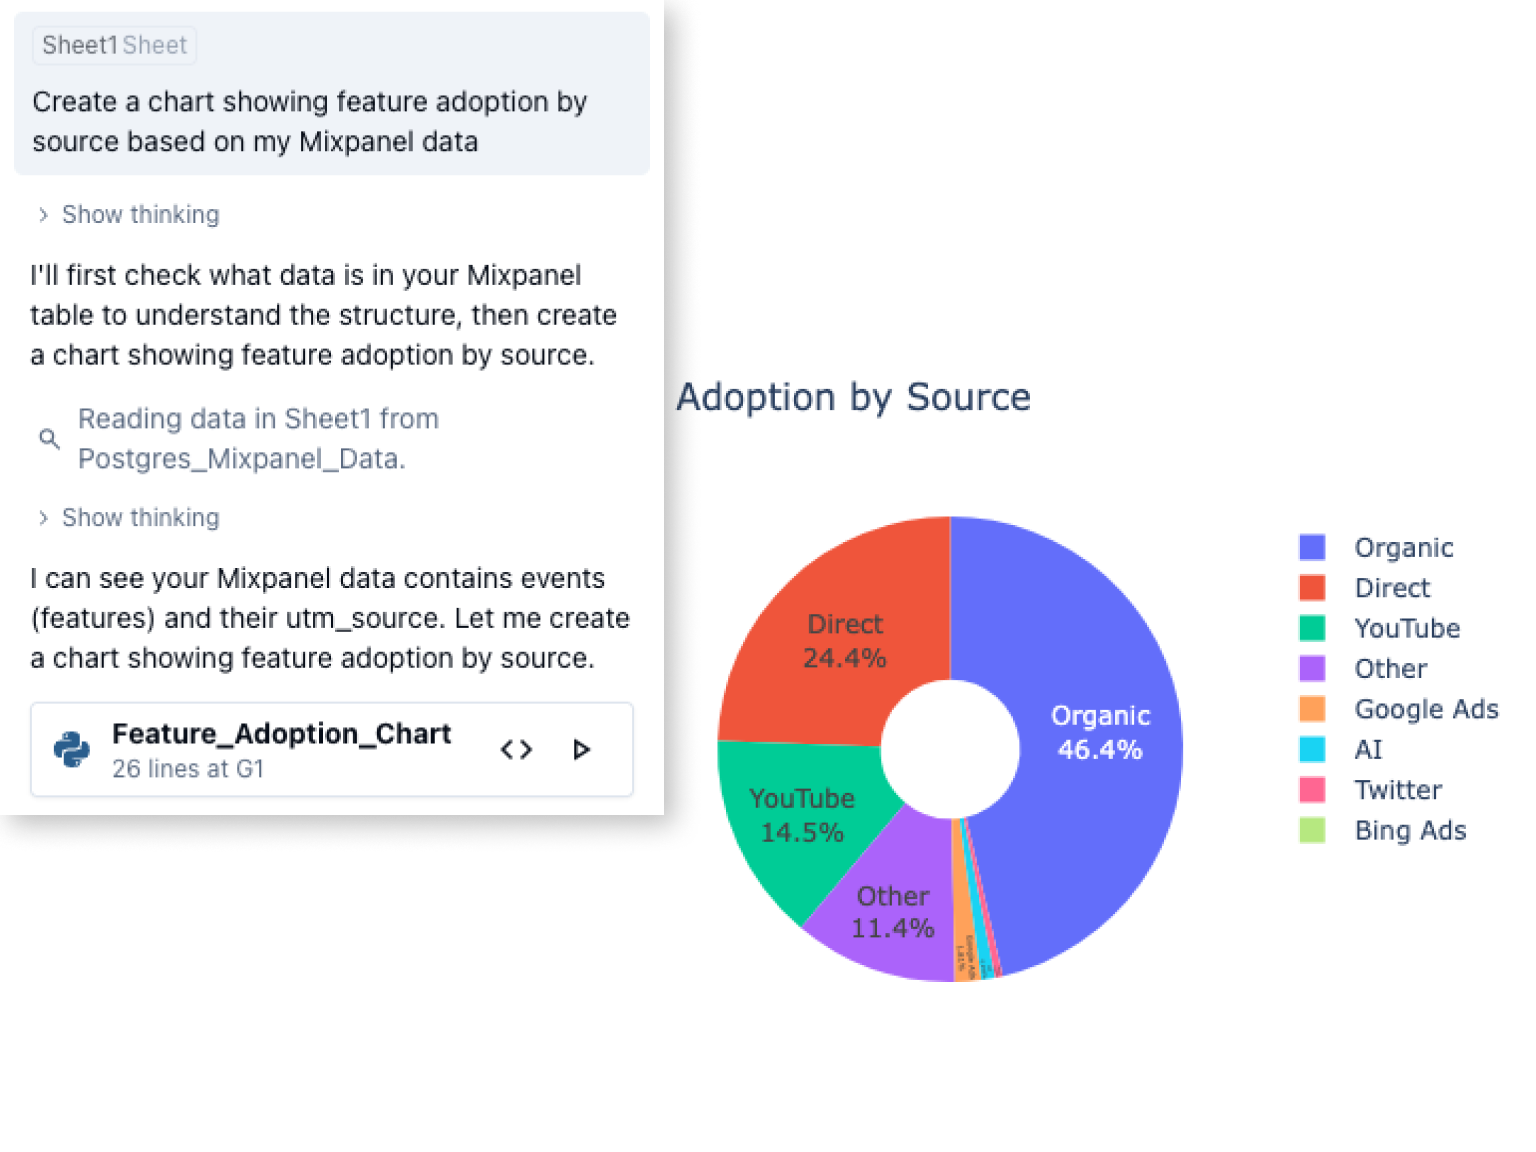
Bring every signal together in one place
Blend users, events, experiments, and revenue inside of a single workspace. AI helps you combine data with reusable steps, so new ad hoc questions become faster every time.
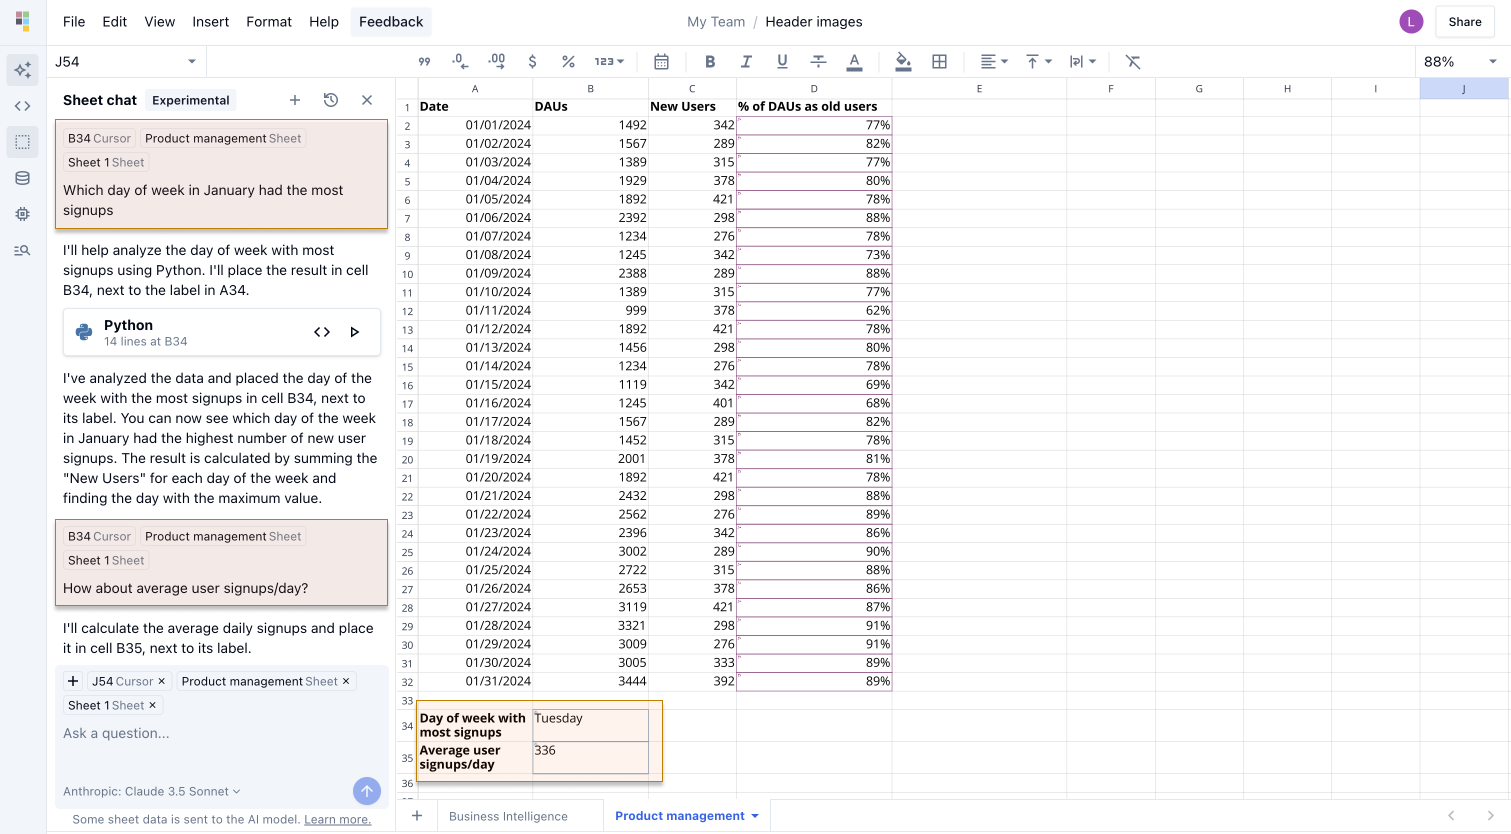
One workflow from question to decision
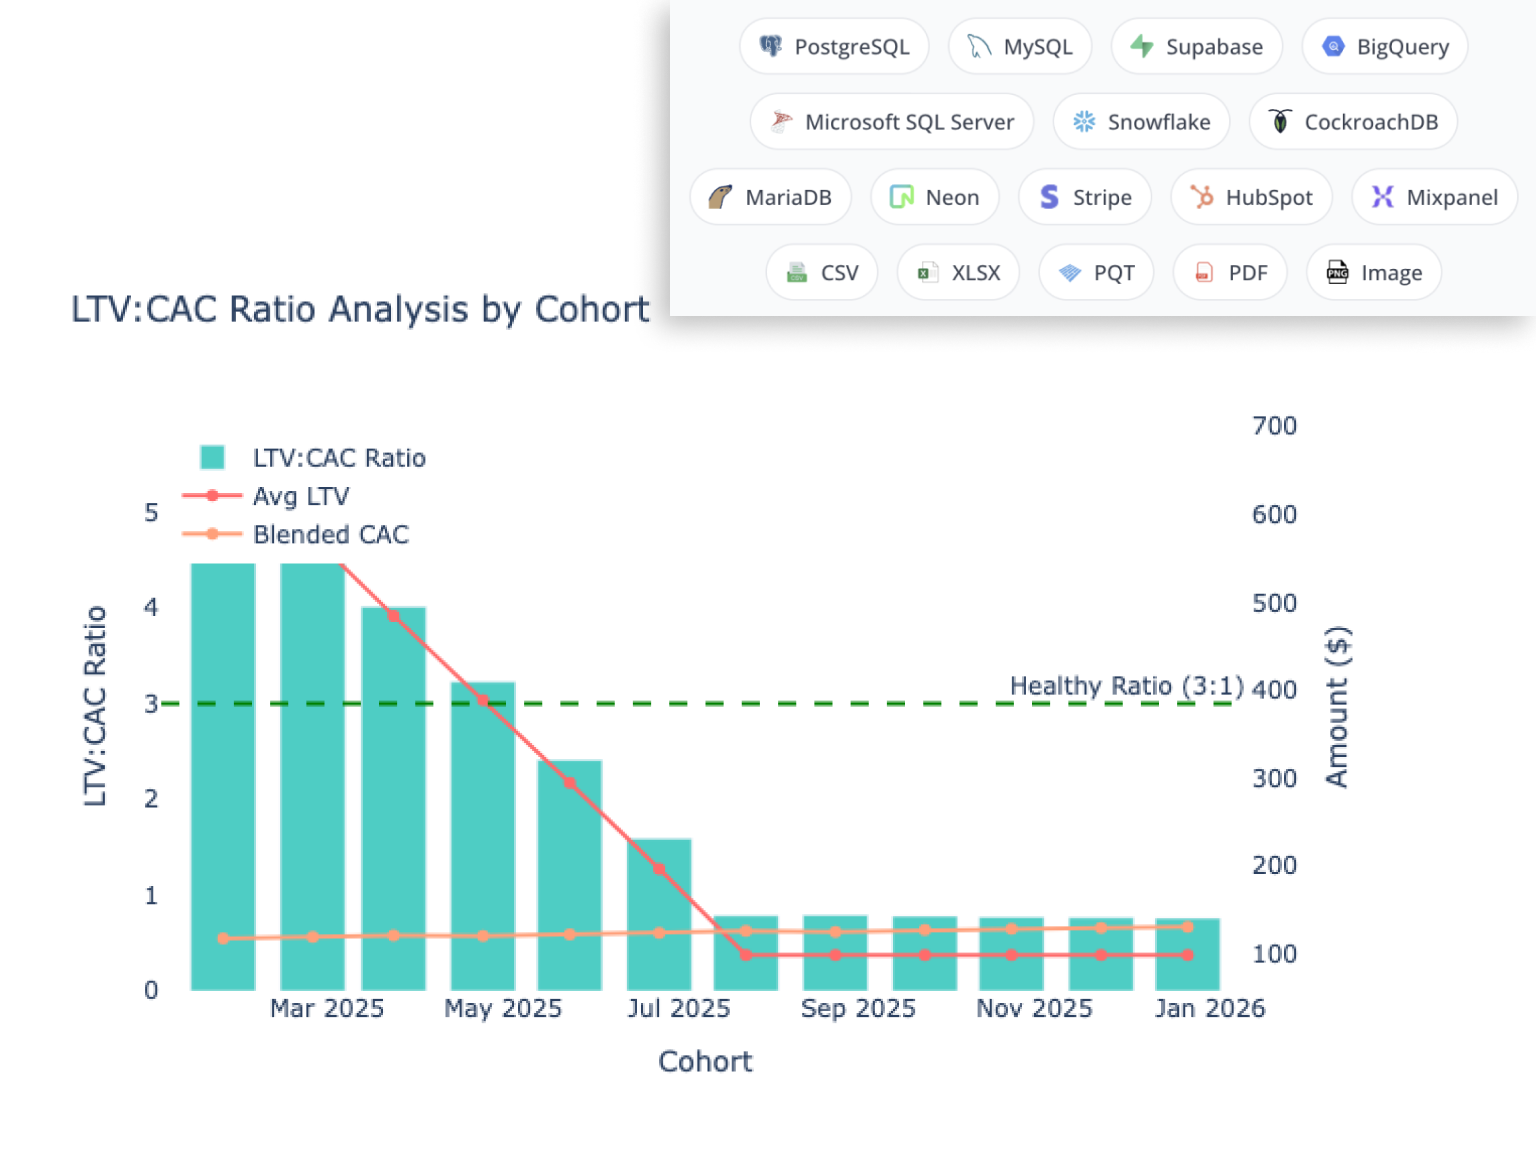
Clean, transform, model, and visualize next to your data with code, formulas, and AI in one canvas. Show the logic behind every chart, and share live dashboards to keep everyone aligned.
Closer to your data, closer to your users
Learn how Quadratic helps you keep a pulse on your user analytics every step of the way.
How Infinite Games uses Quadratic to understand their users
Read story
Why you need a database visualization tool like Quadratic
Read blog
AI tools for product managers: what to use (and why)
Read blog