AI Chart Generator
Use Quadratic AI to create charts from your spreadsheet data. Add data, describe the visualization you want, and get publication-ready charts in seconds.
Turn your data into visualizations with AI
Prompt Quadratic AI to generate data visualizations. Transform raw data into actionable insights in seconds.
How to create charts with AI
Go from raw data to a polished chart in three steps — no chart wizard, no manual formatting.
Add your data
Import any file - CSVs, Excel files, Google Sheets, and PDFs - or connect to your data directly. Your data lives in a familiar spreadsheet where you can clean, filter, and prepare it before charting.
| A | B | C | D | |
|---|---|---|---|---|
| 1 | Region | Q1 | Q2 | Q3 |
| 2 | North America | $420K | $445K | $468K |
| 3 | Europe | $310K | $328K | $341K |
| 4 | Asia Pacific | $285K | $302K | $318K |
| 5 | Latin America | $142K | $155K | $168K |
Describe your chart
Tell the AI what visualization you want in plain English. It reads your data structure, picks the right chart type, and generates the visualization — bar charts, line graphs, scatter plots, and more.
Customize and share
Tweak colors, labels, axes, and legends to match your brand. Charts stay linked to your data so they update automatically. Share with teammates or export for presentations.
Chart preview
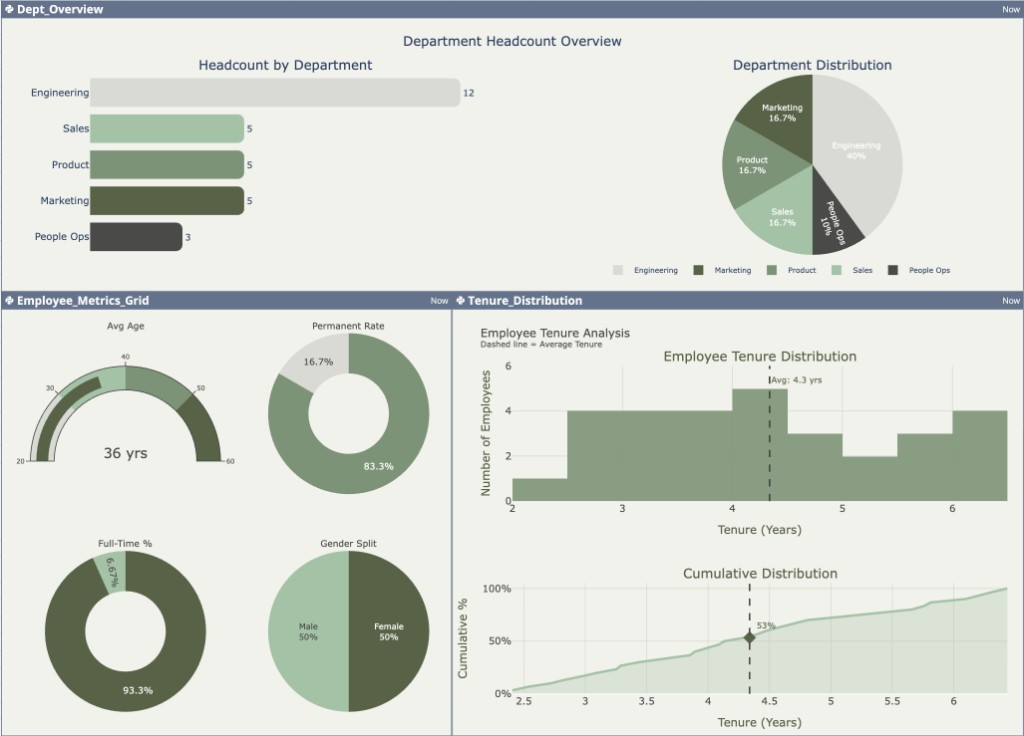
Multi-chart dashboard — updates when your data changes
AI charts for every workflow
From sales dashboards to research plots, AI-generated charts work across every data workflow.
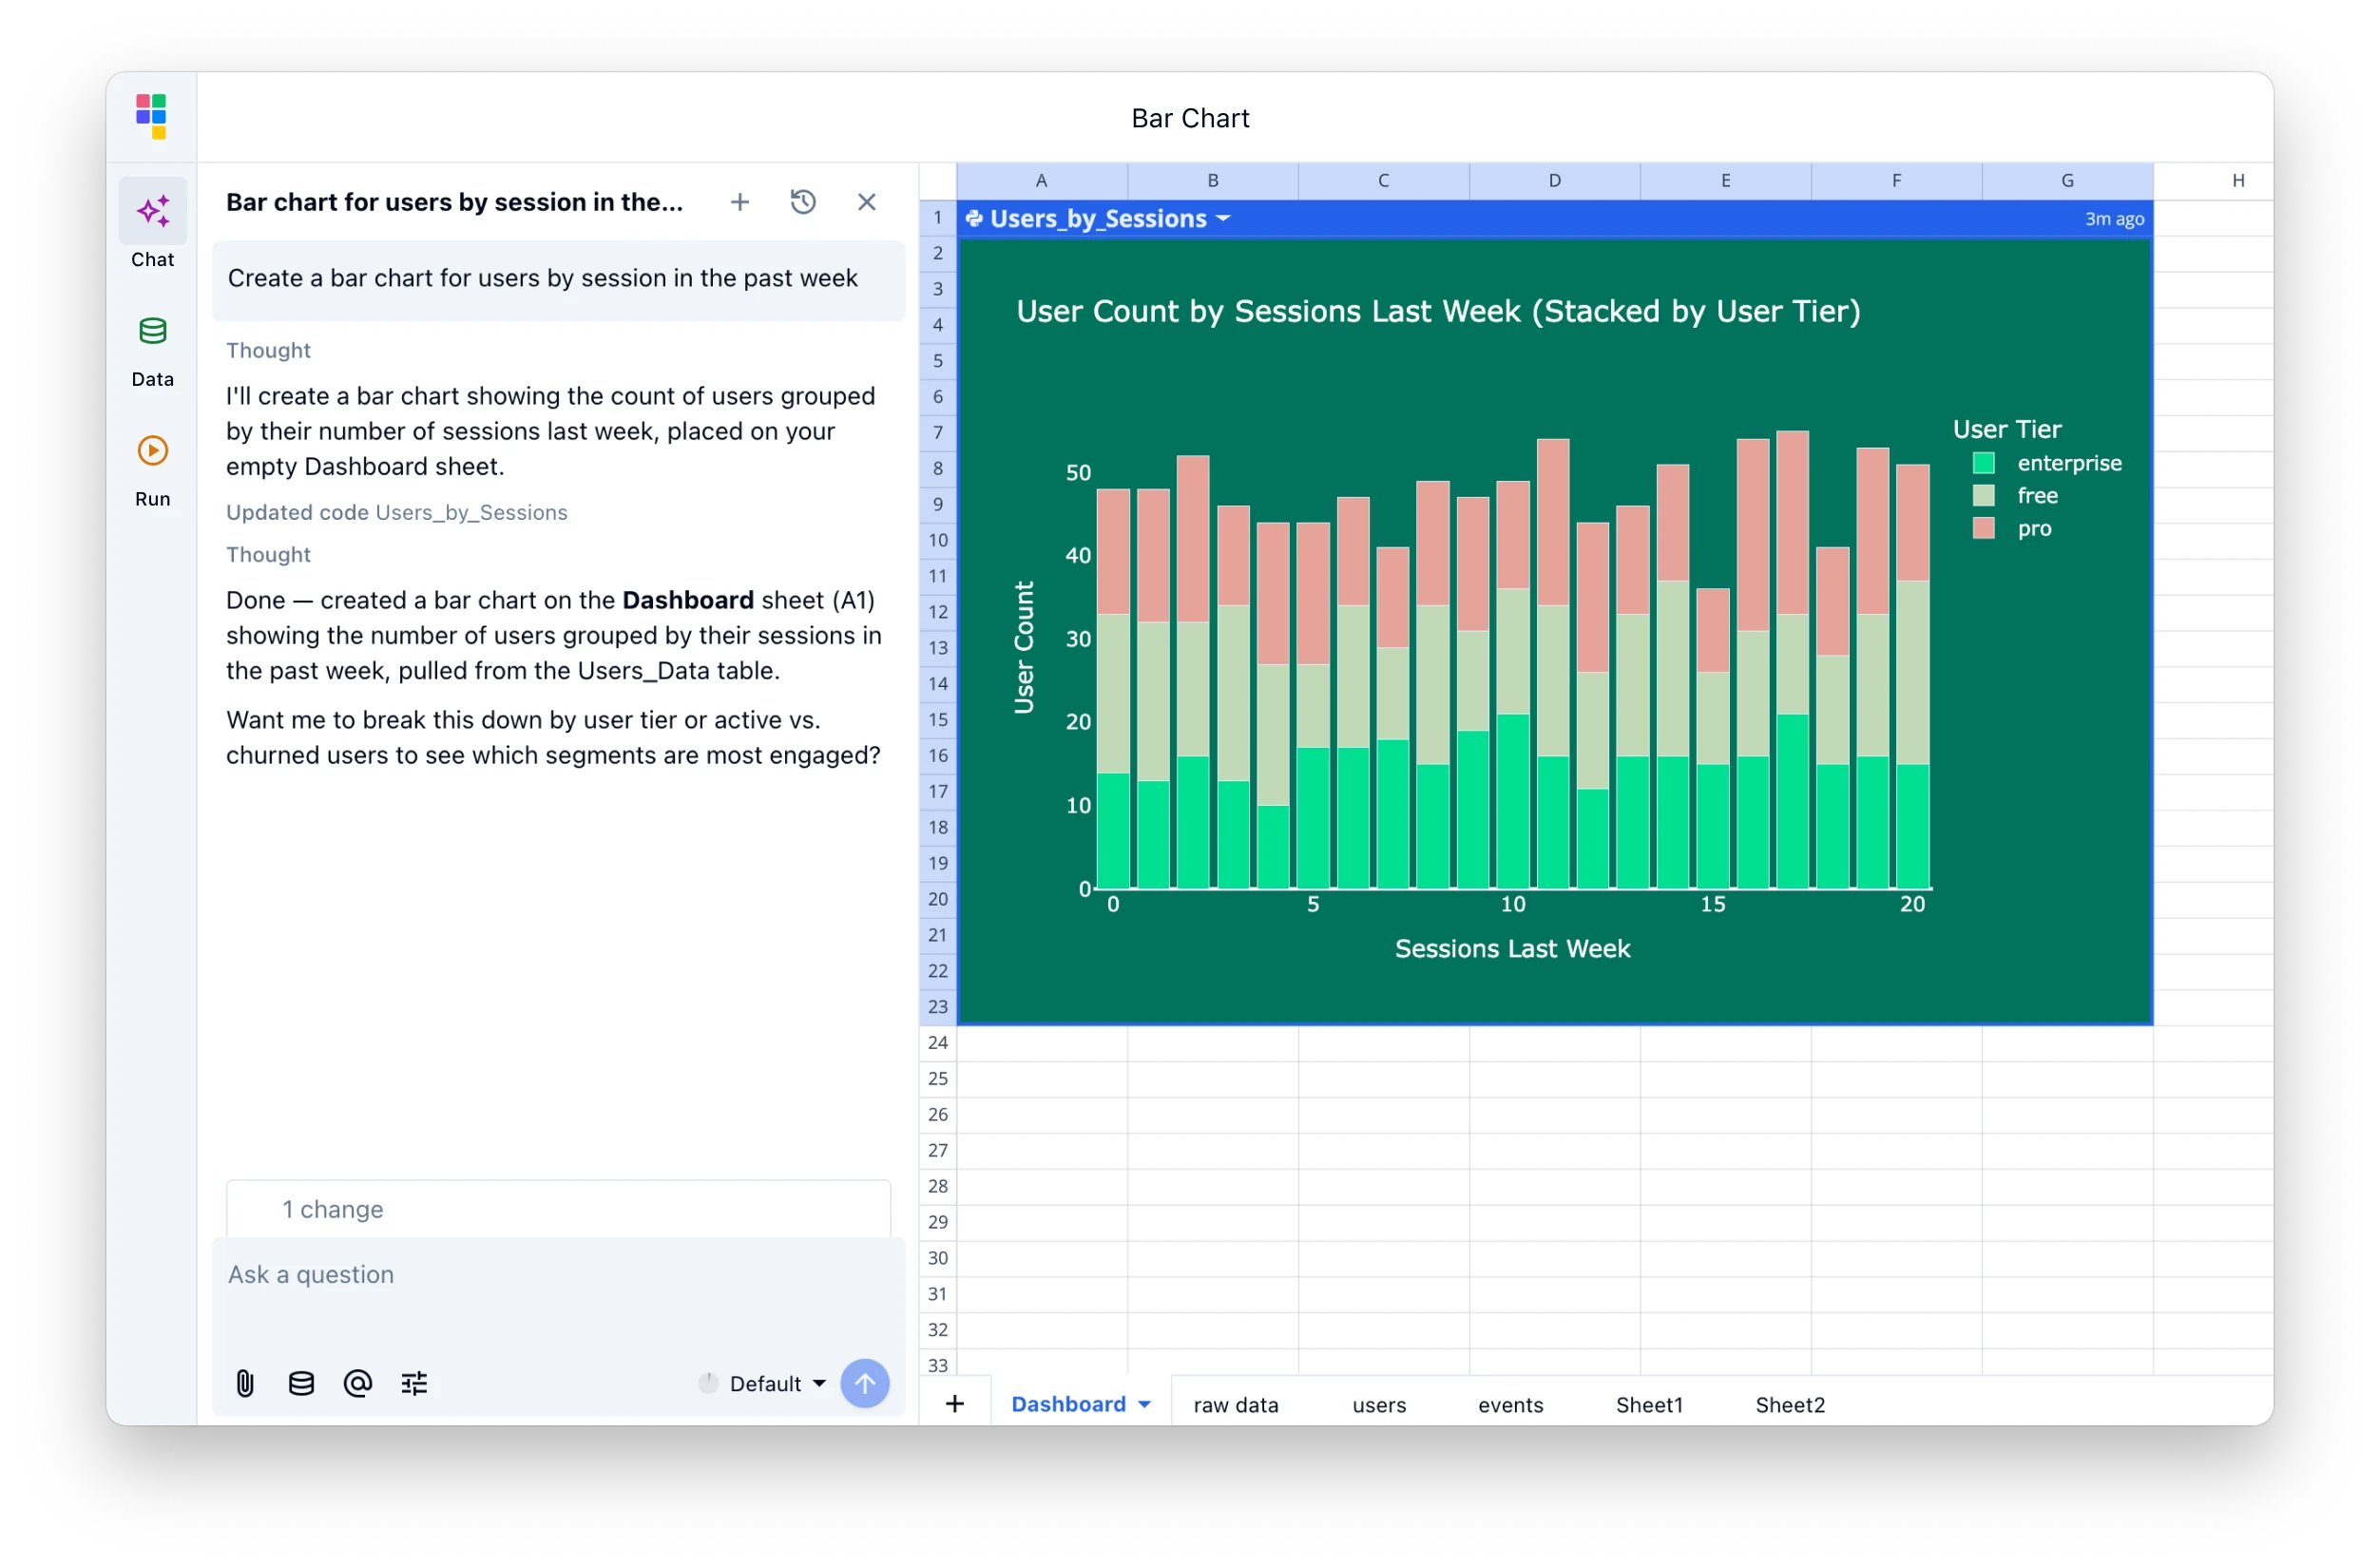
Sales & revenue dashboards
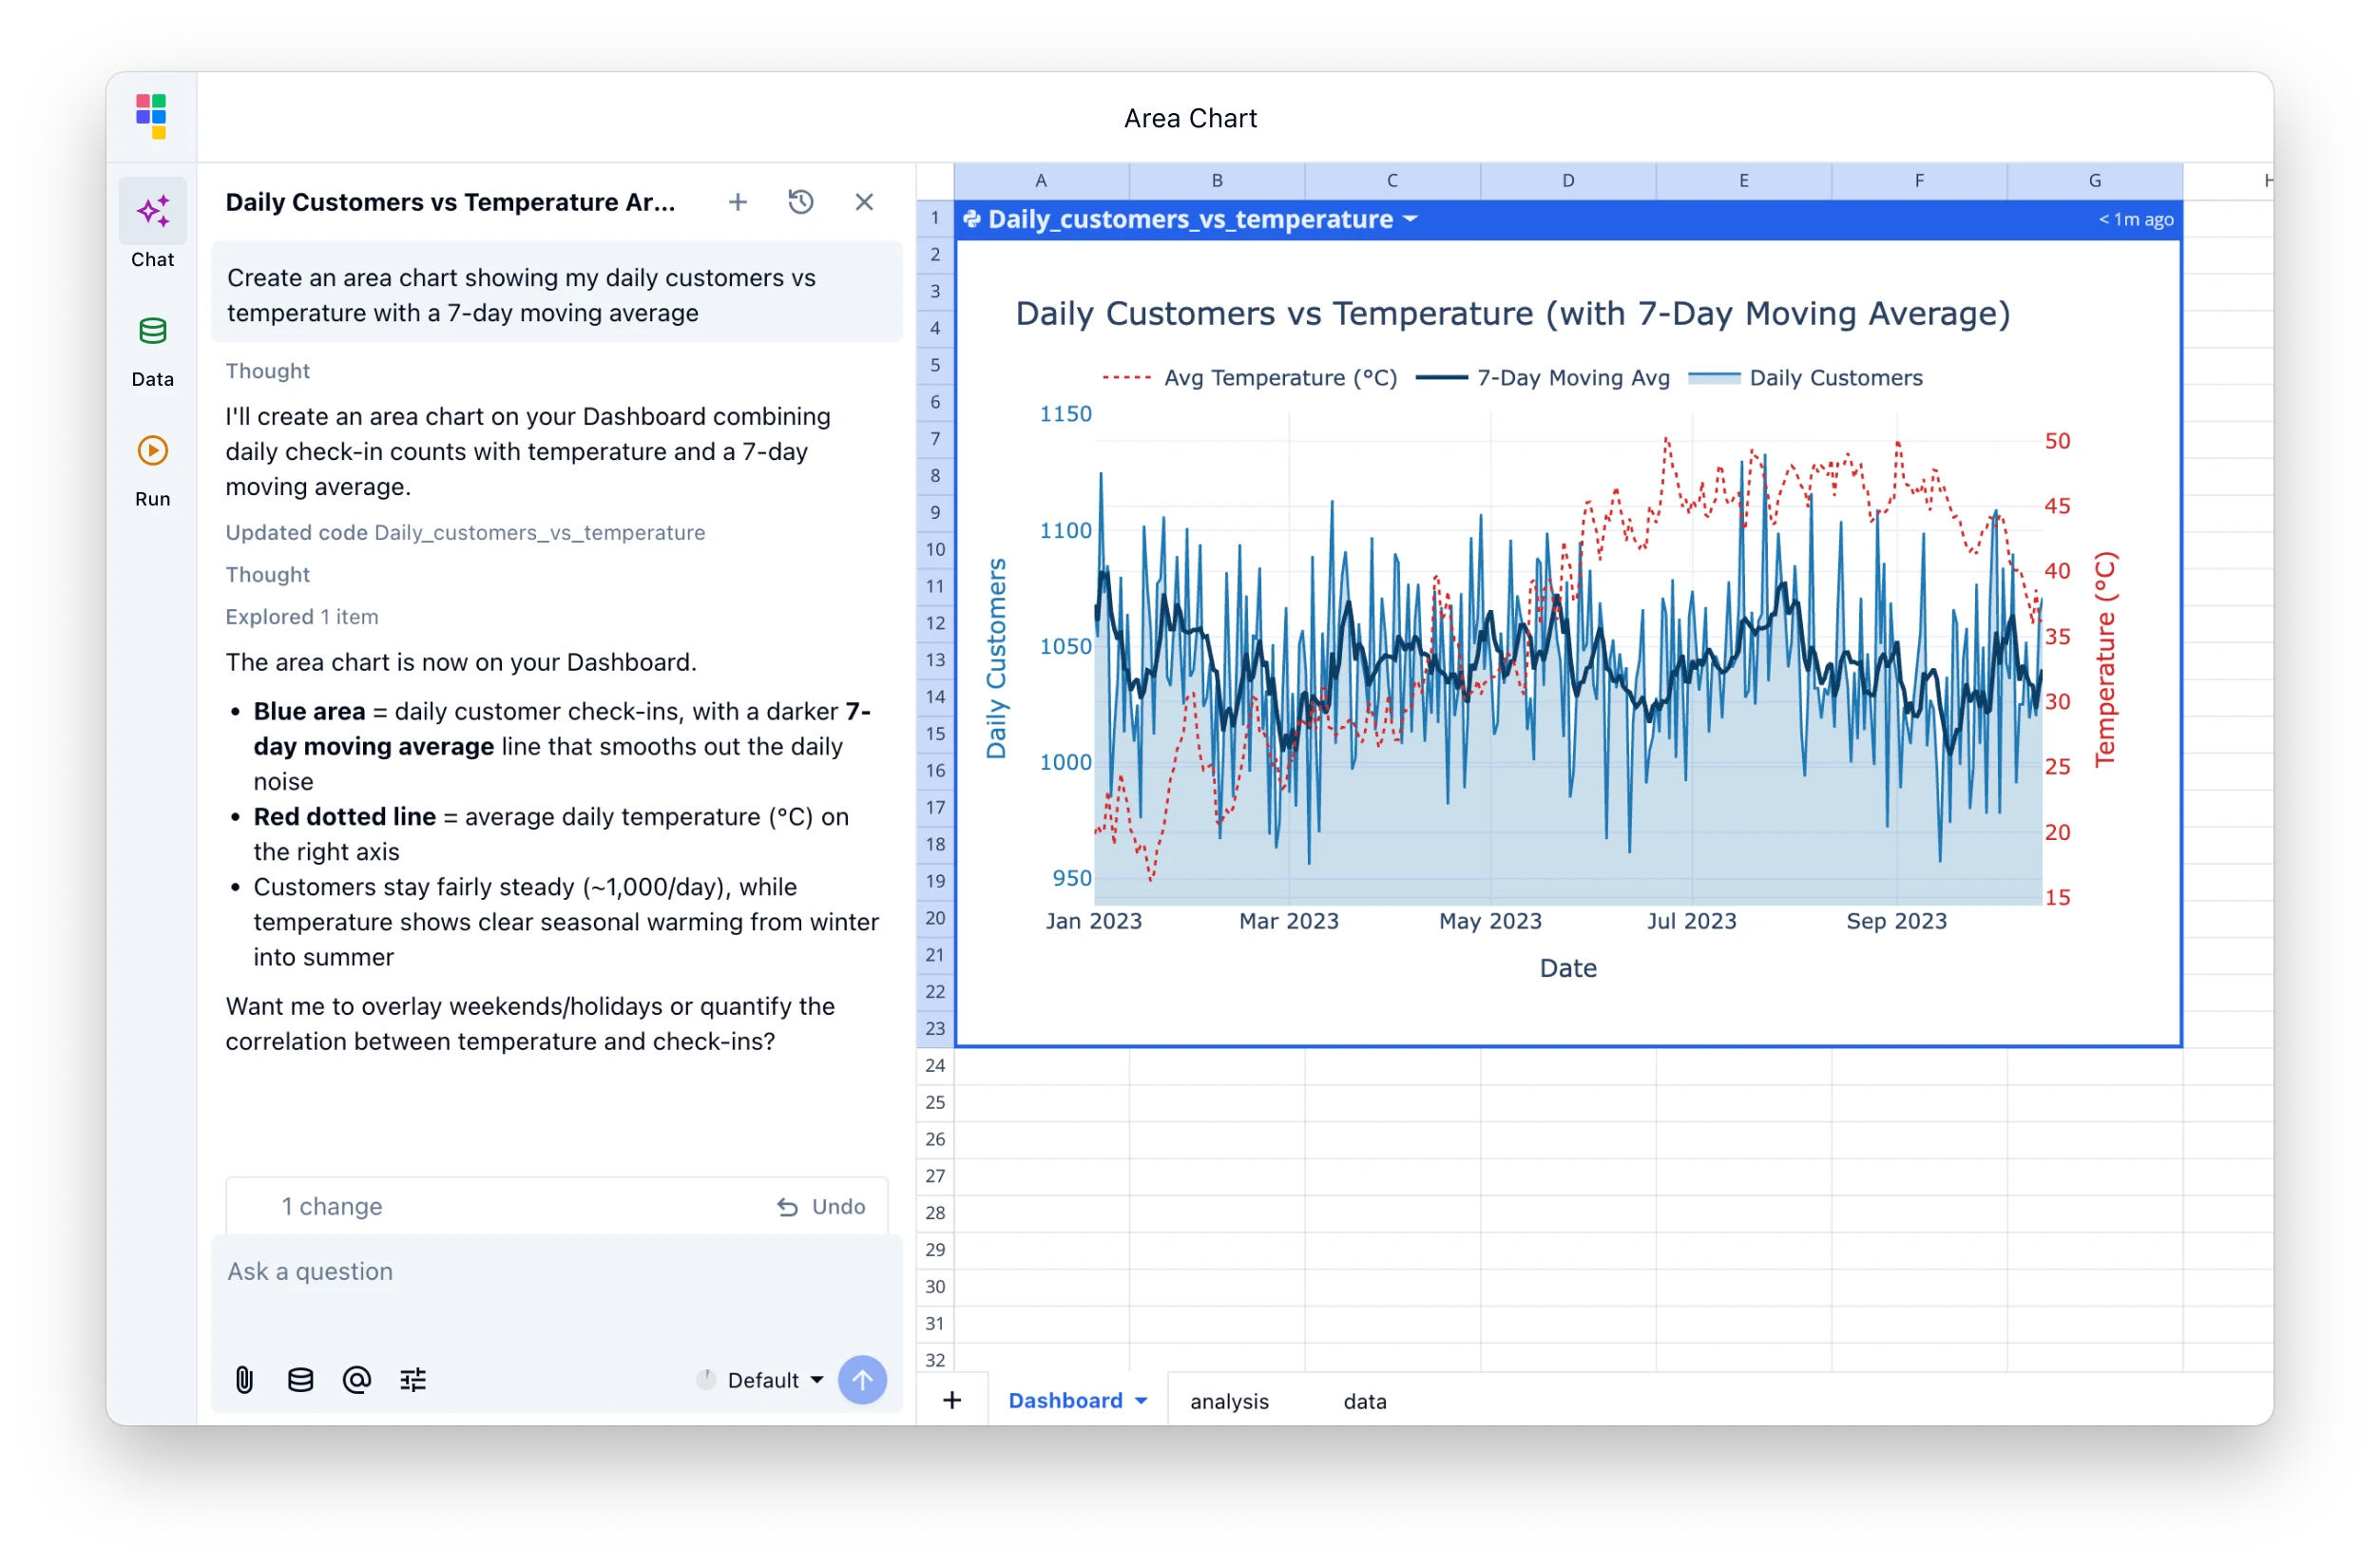
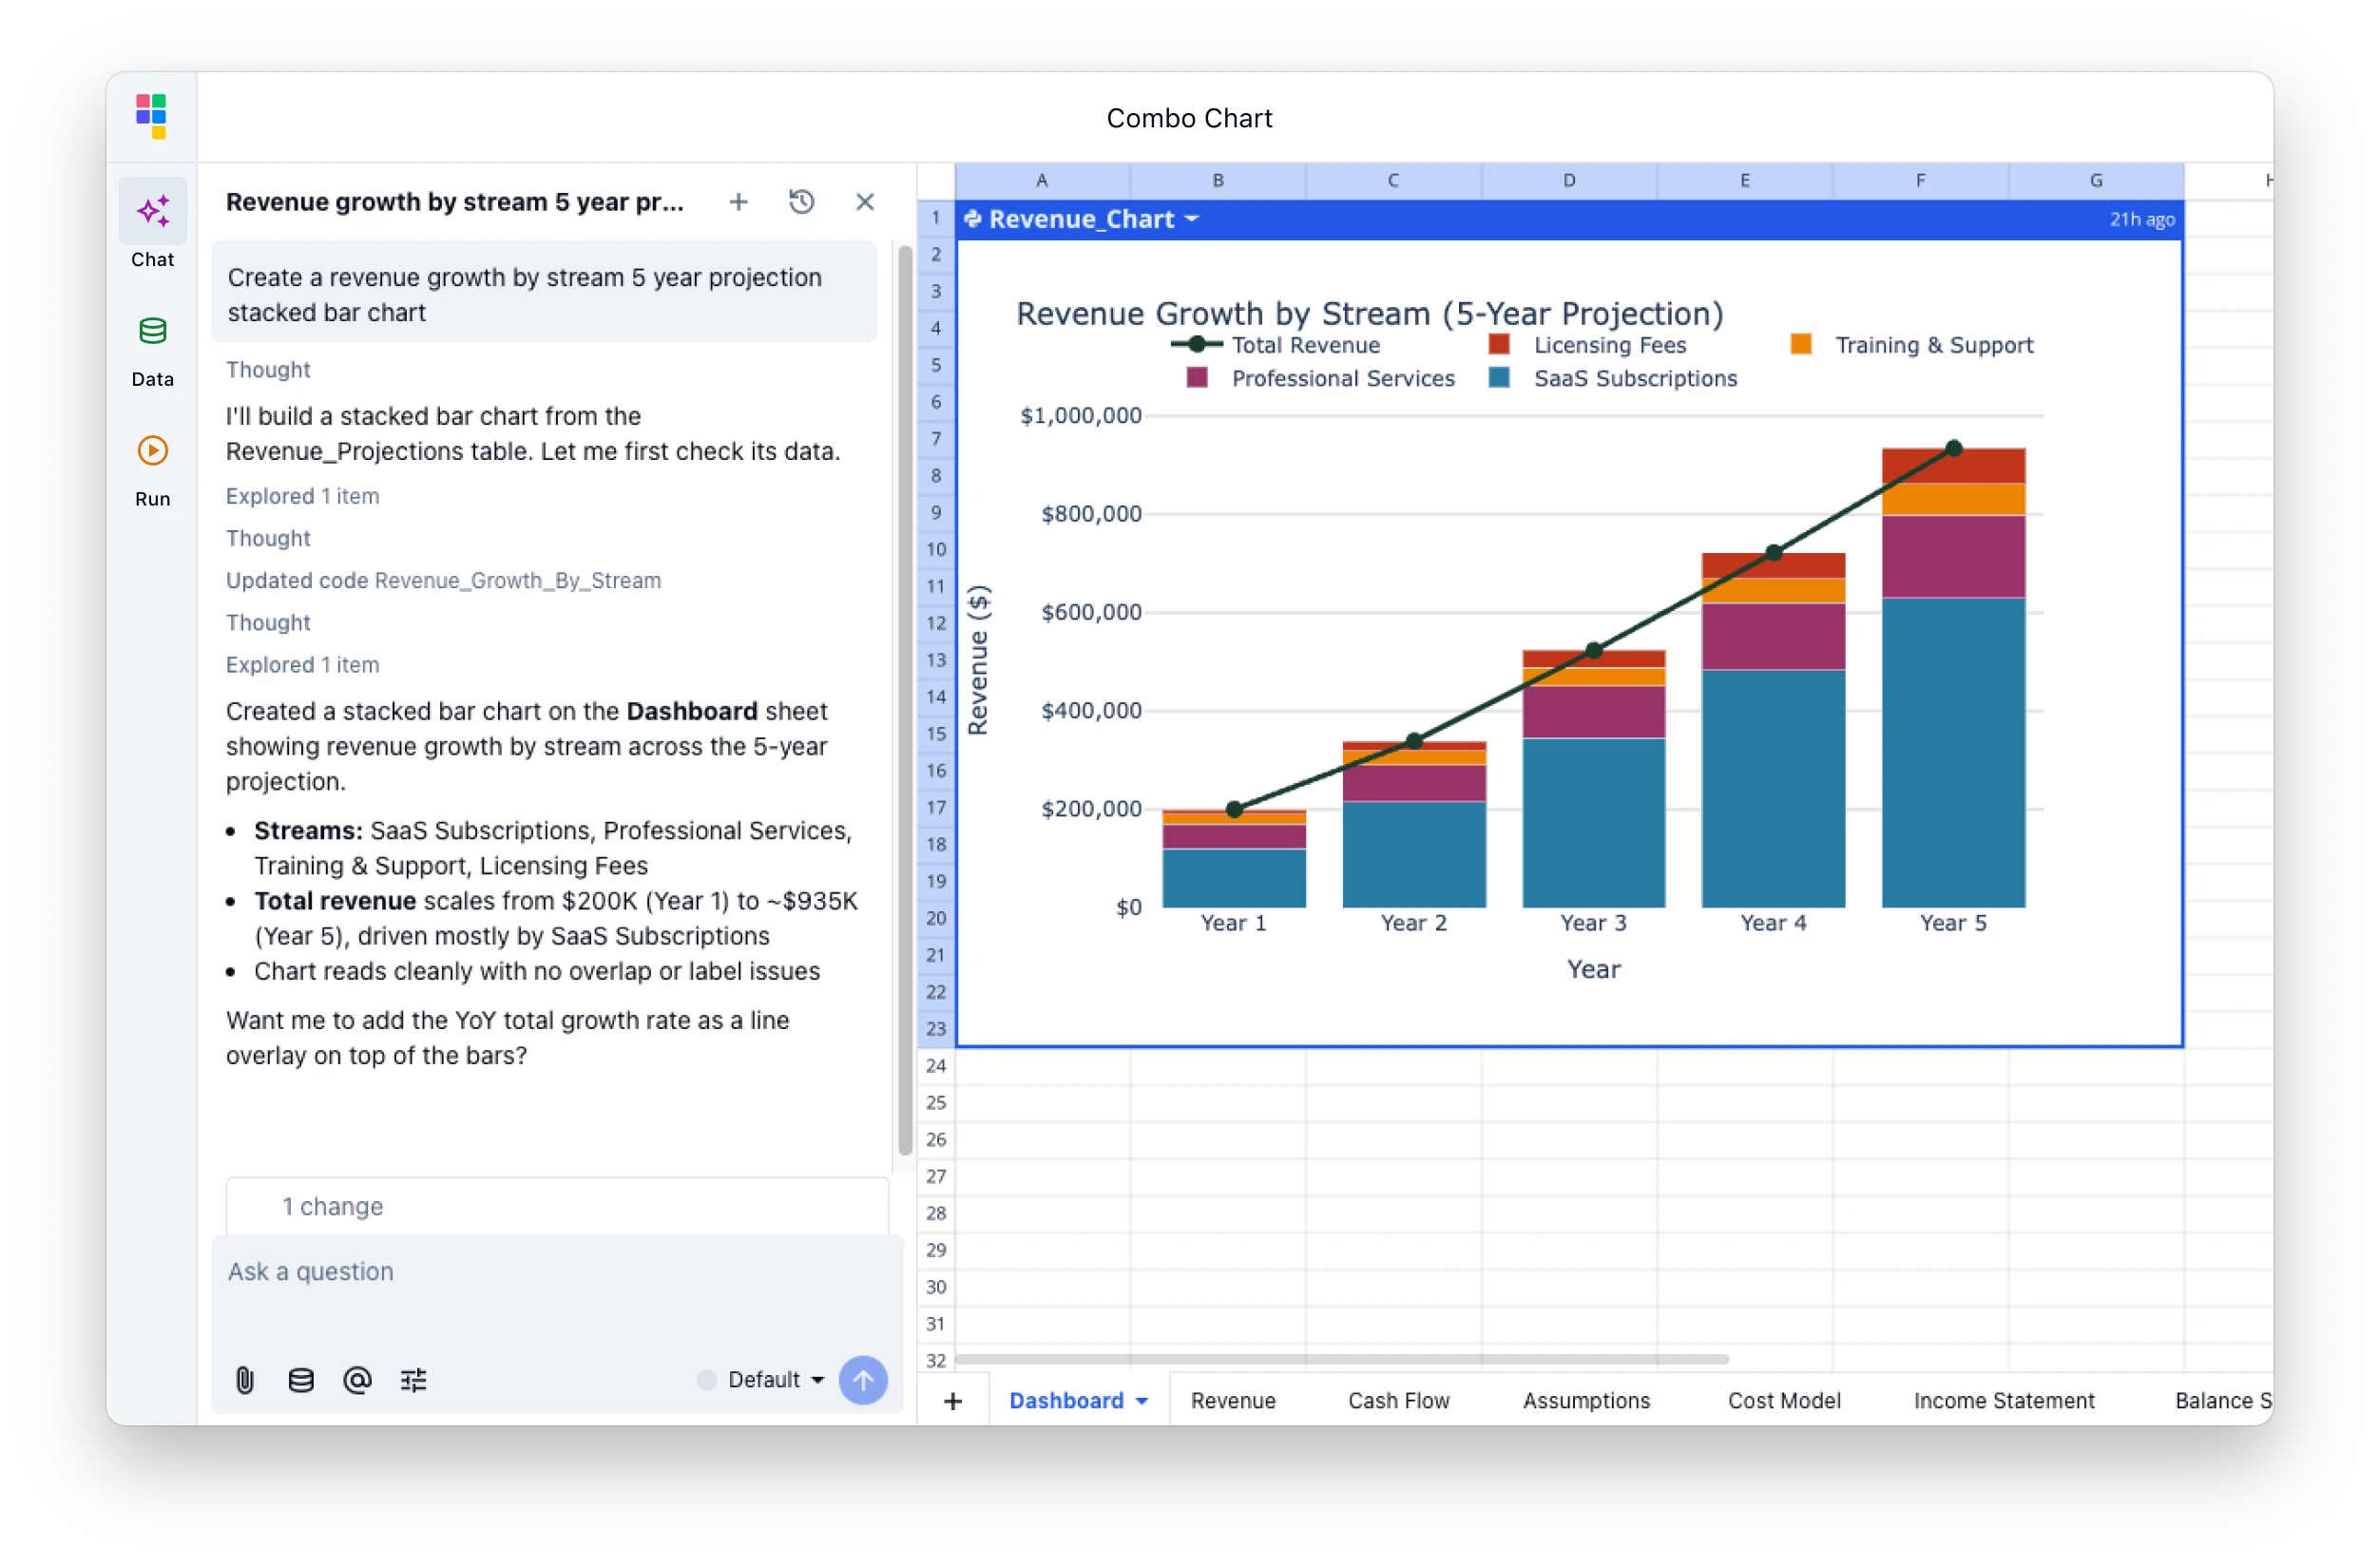
Turn quarterly sales data into bar charts, line trends, and combo visualizations. Compare regions, products, and reps without leaving your spreadsheet.
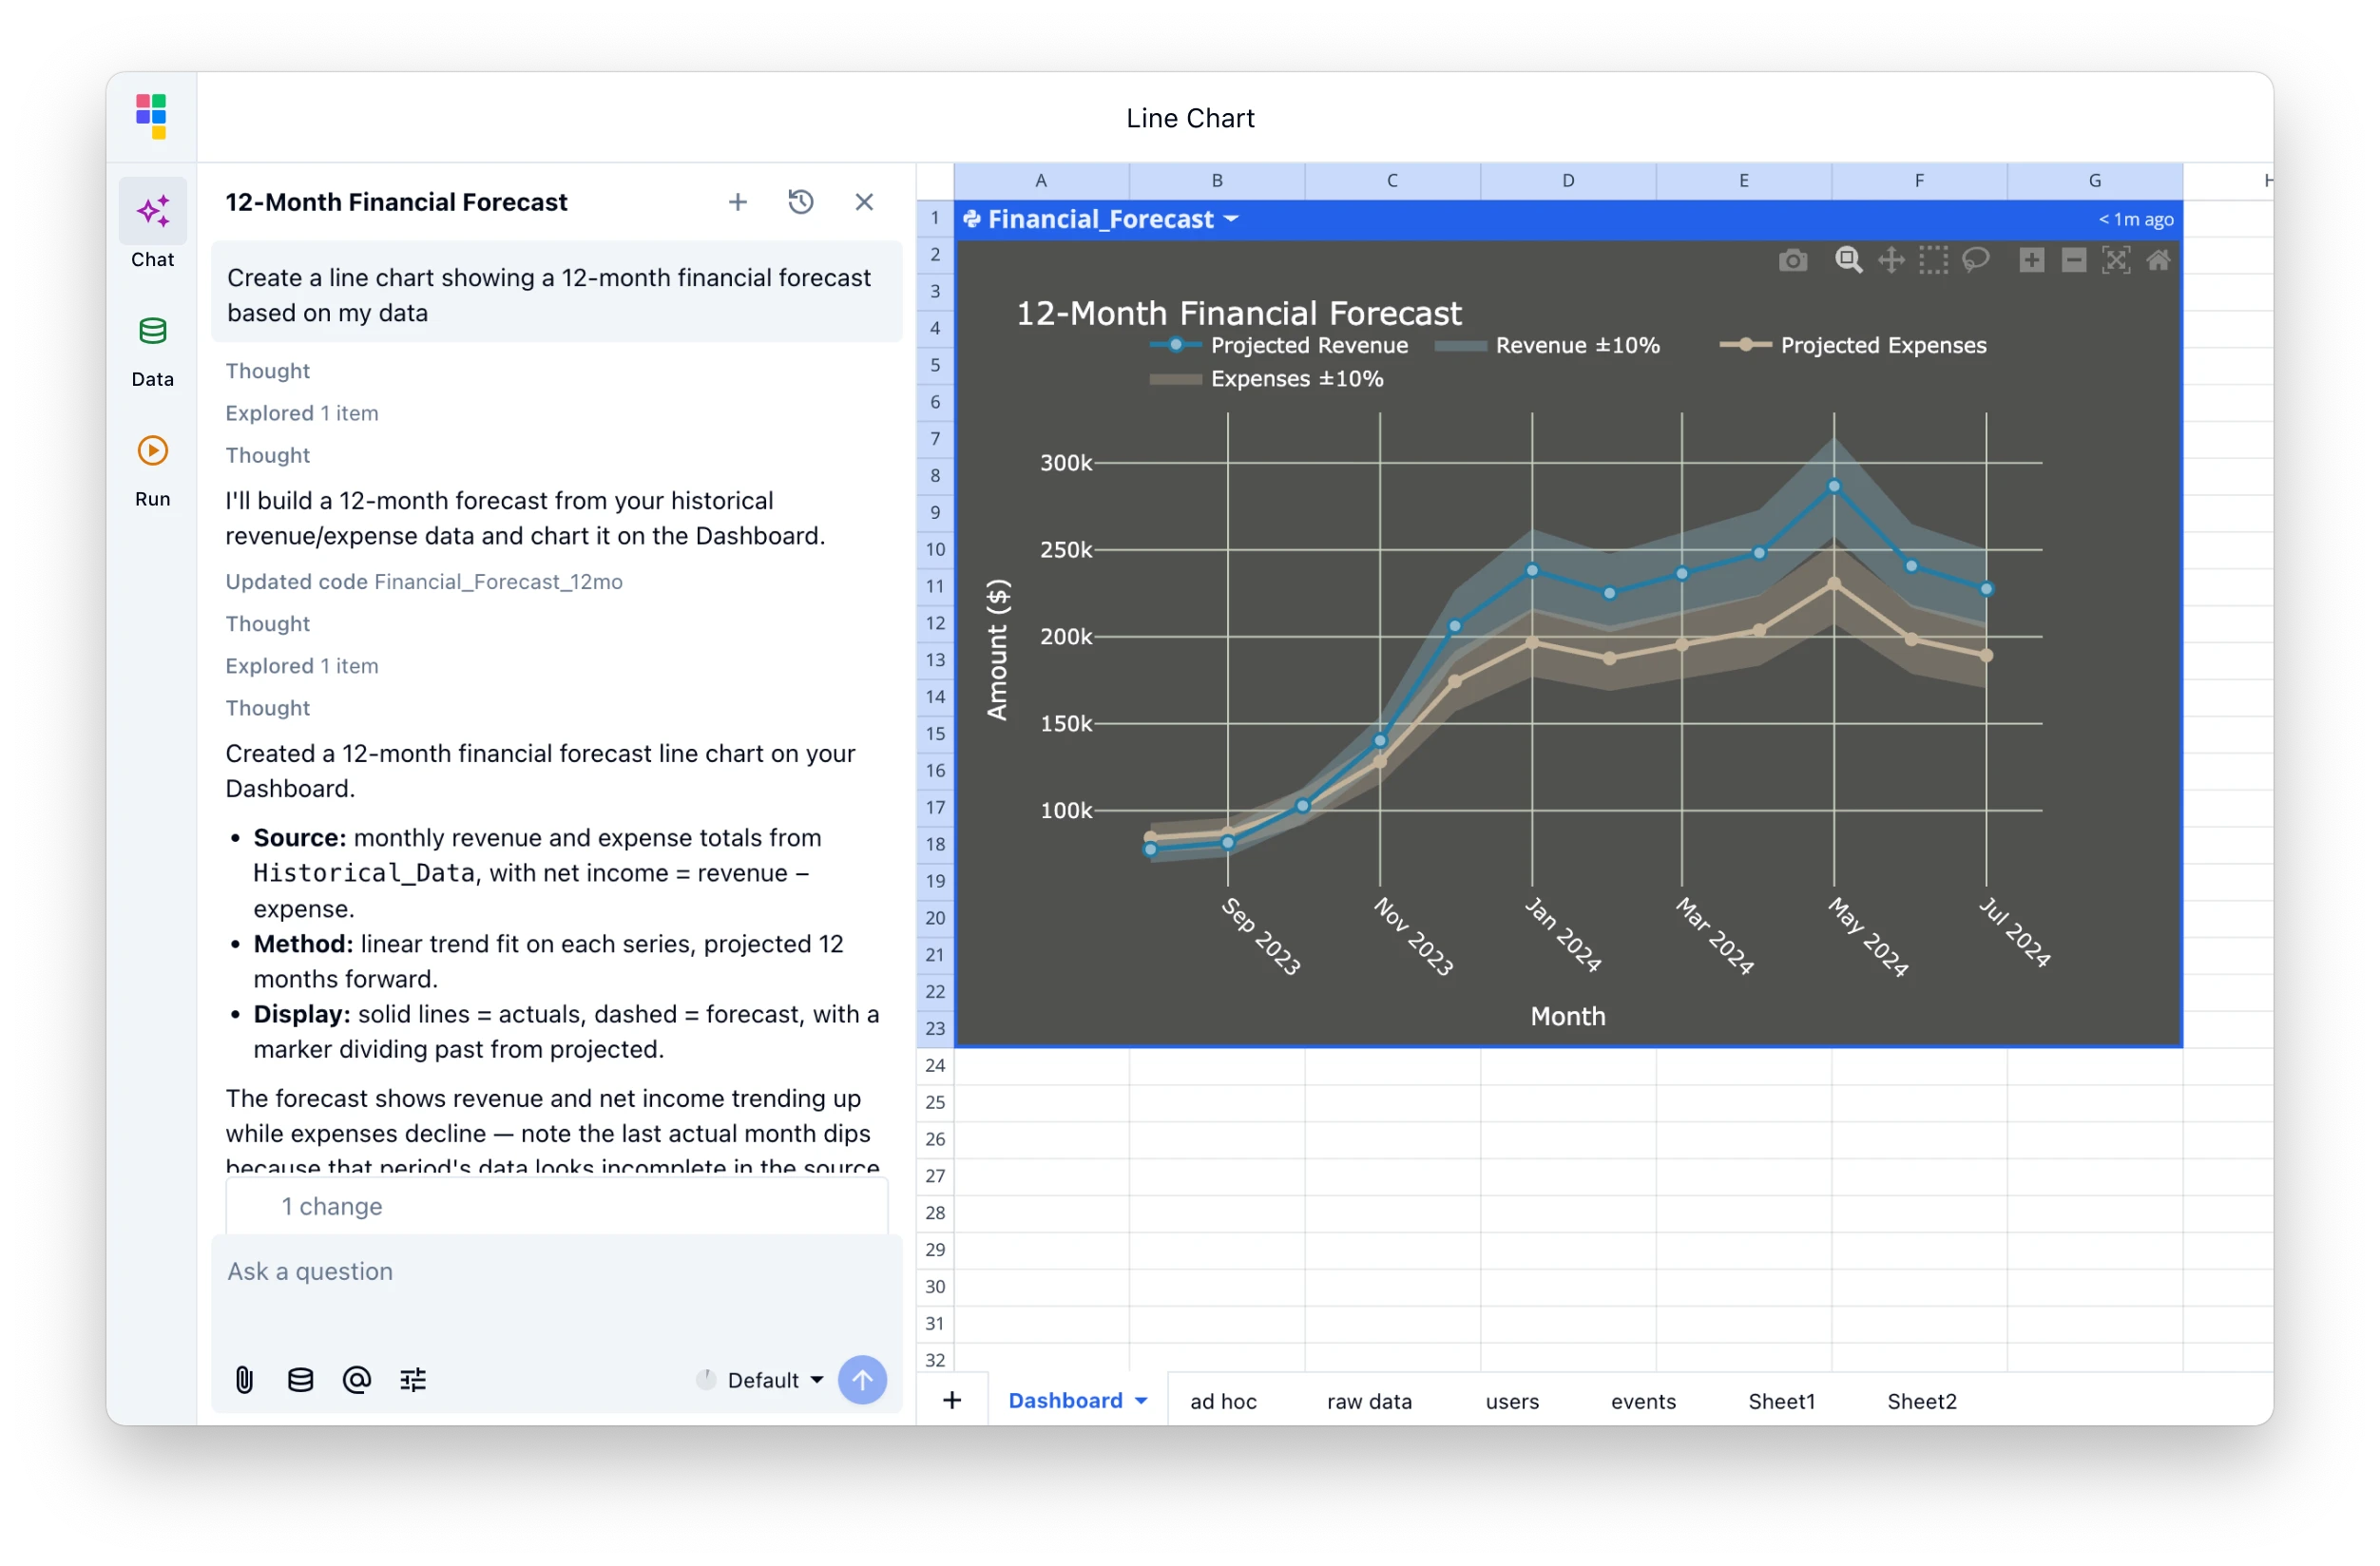
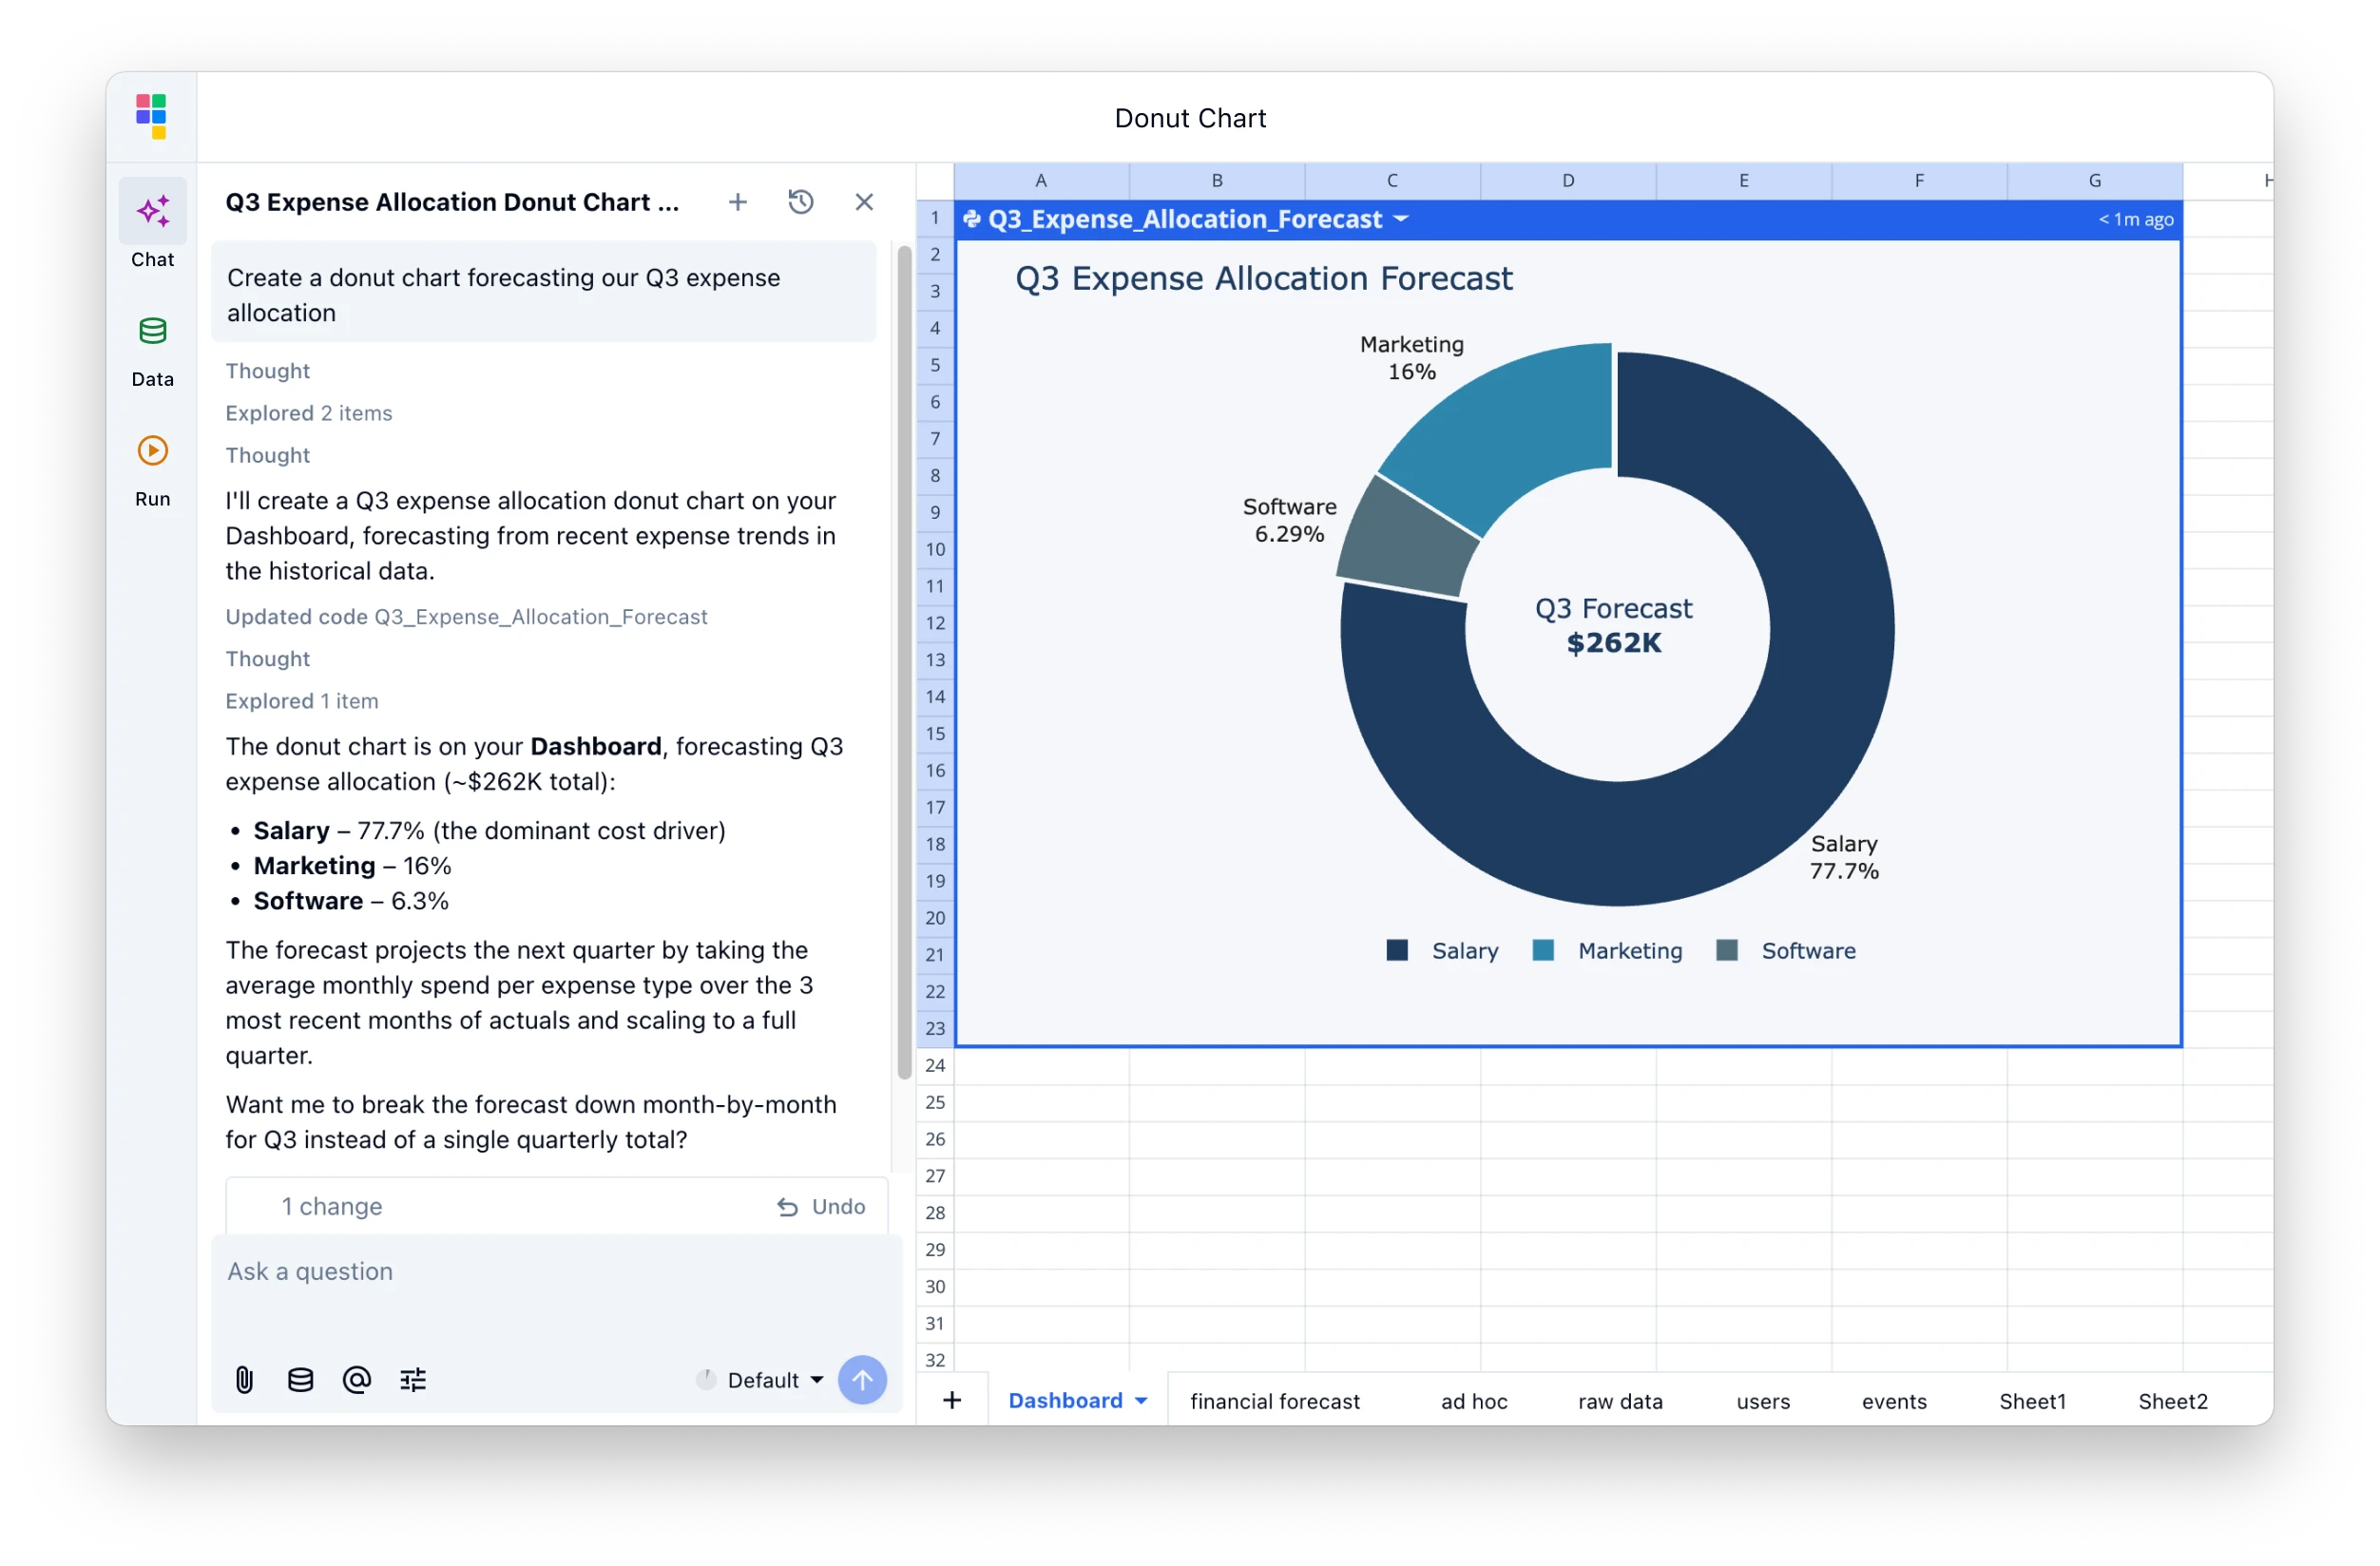
Financial reporting
Chart income statements, cash flow, and KPIs from your financial data. AI understands numeric columns and time periods to pick the right chart type.
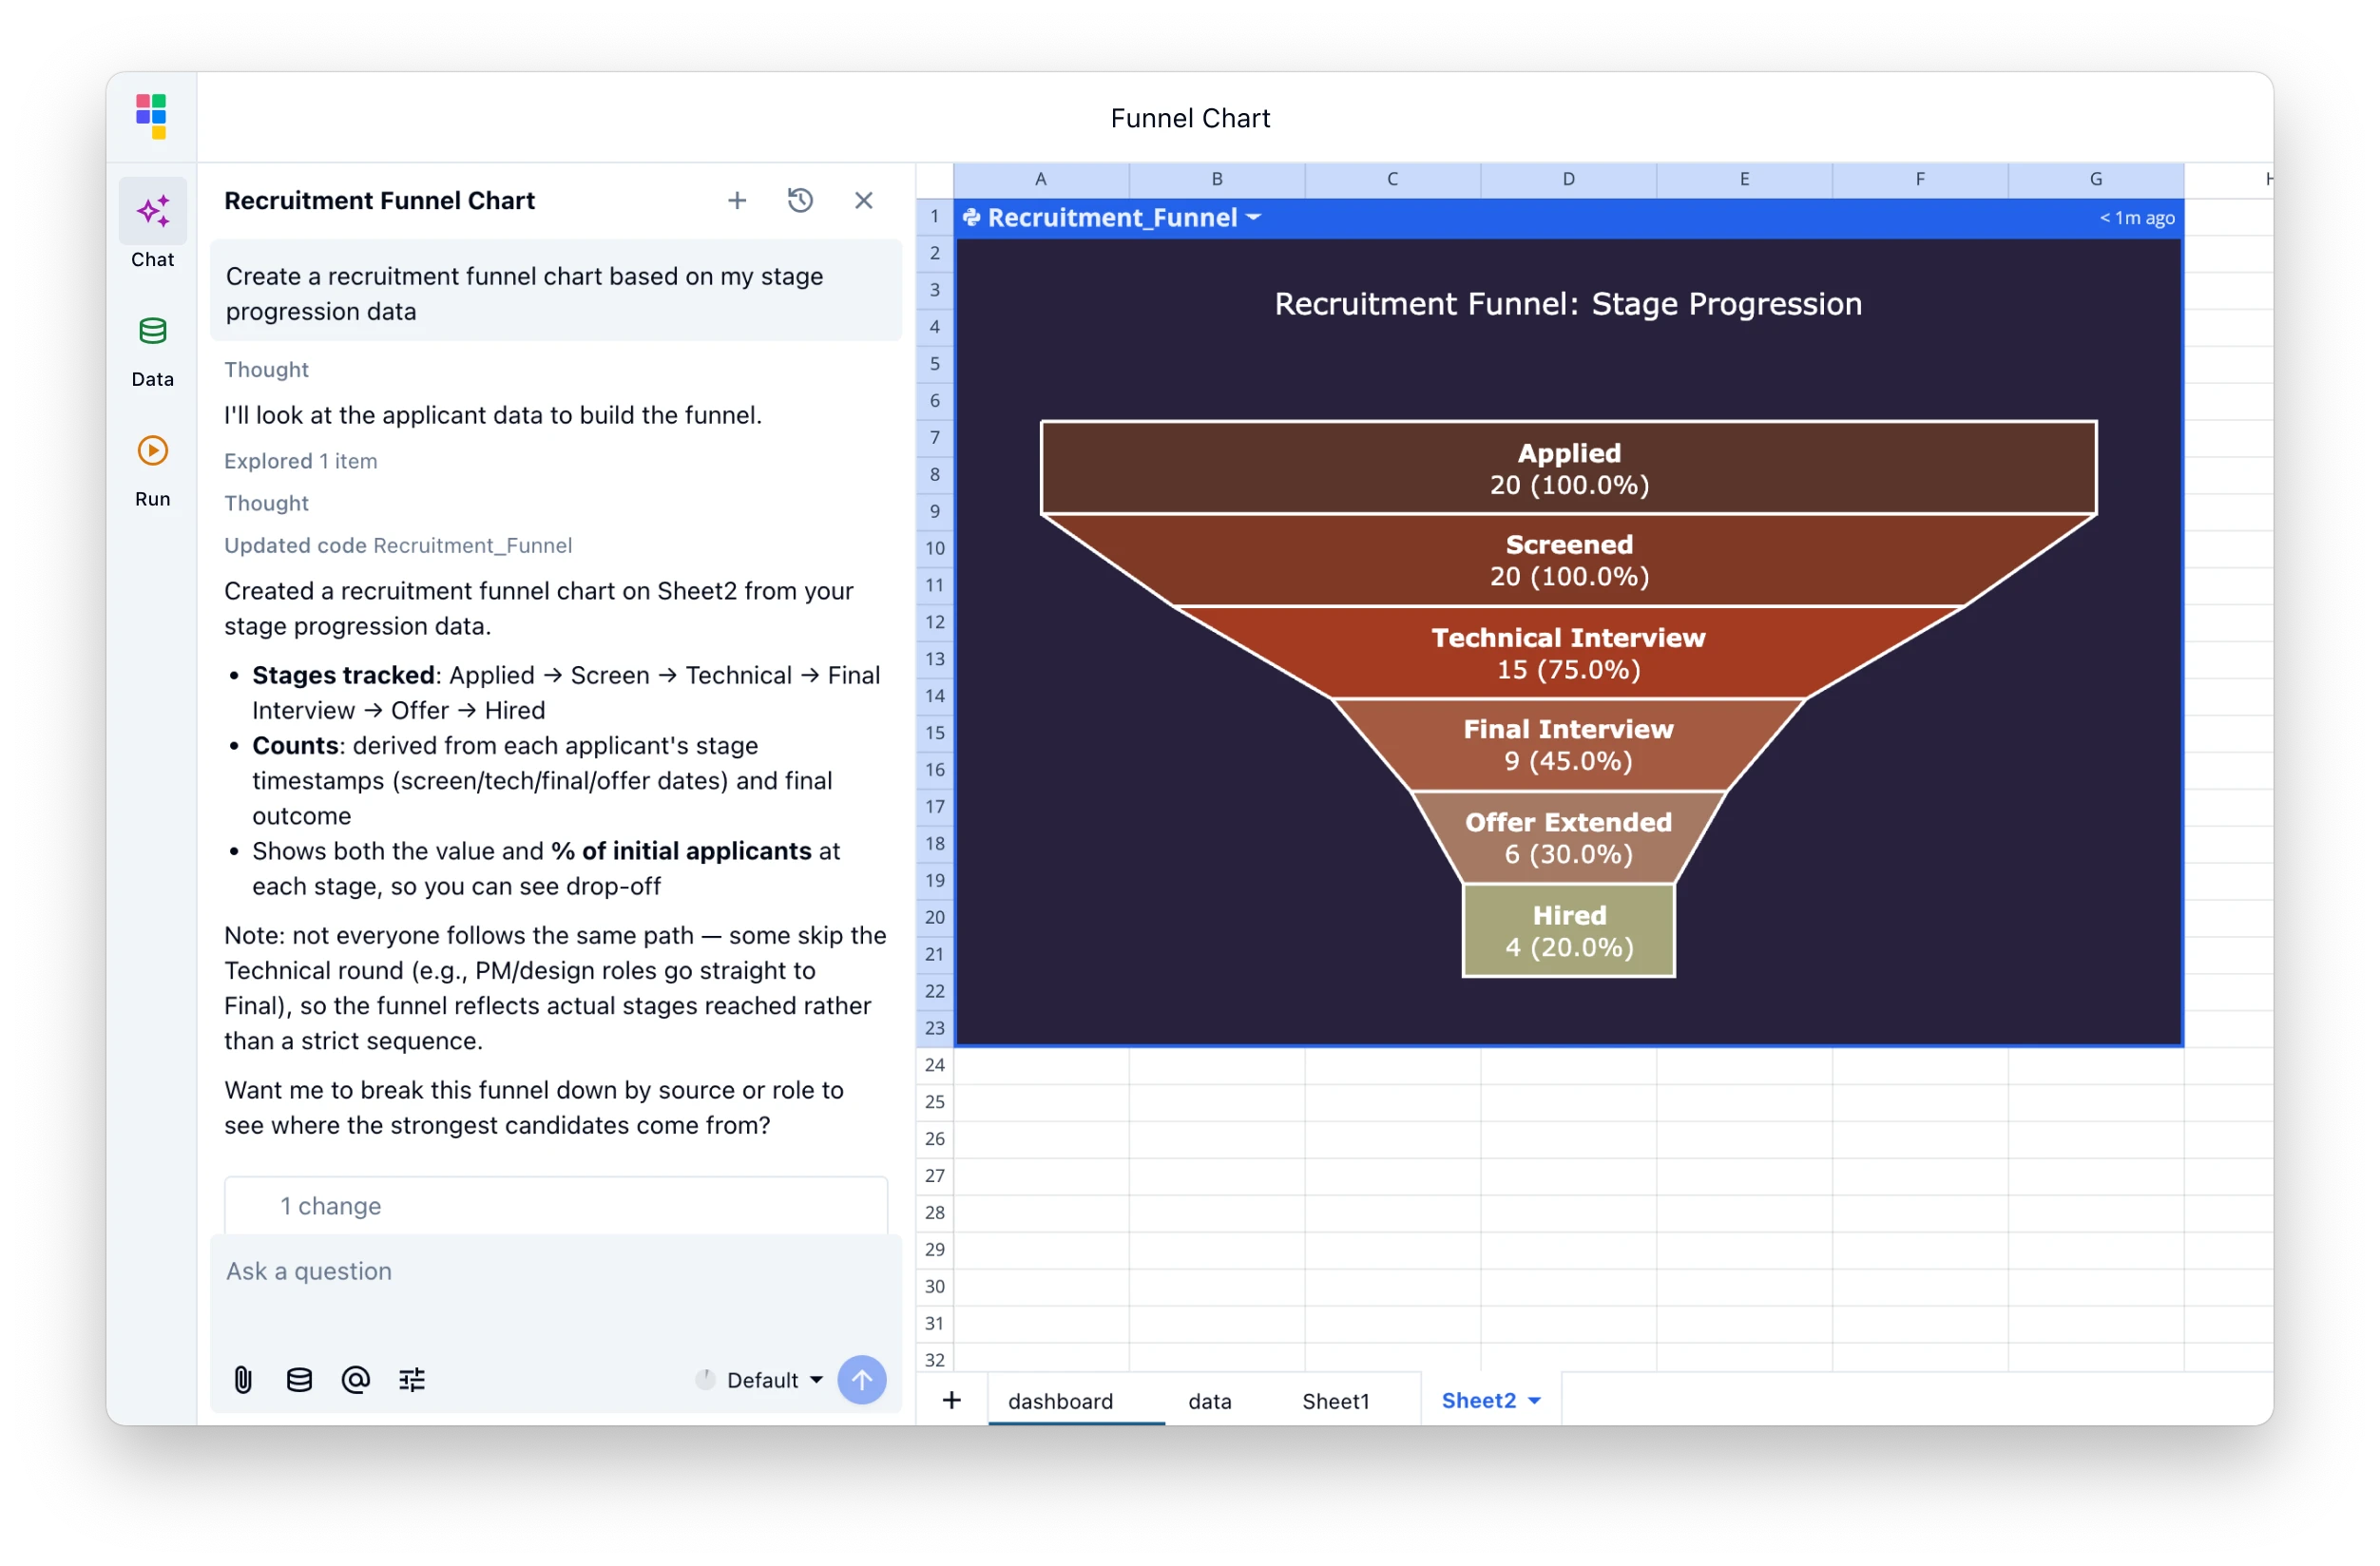
Marketing analytics
Visualize campaign performance, funnel metrics, and channel attribution. Create scatter plots for spend vs. conversions or stacked area charts for traffic trends.
Scientific & research data
Plot experimental results, survey distributions, and statistical summaries. Use Python Plotly or JavaScript Chart.js for publication-quality visualizations.
Stop building charts by hand
Go from data to visualization in seconds. Describe your chart, let AI build it, and customize until it's perfect. Free to start, no install required.
Create Charts FreeAI chart generator FAQ
How do I create charts using AI in Quadratic?
Add your data into Quadratic — we support CSV, Excel, Google Sheets, Parquet, database connections, APIs, and business tools like Google Analytics and Mixpanel. Then use natural language to describe the chart you want. Quadratic AI generates a visualization based on your description and data, which you can customize further.
What types of charts can I create with Quadratic AI?
Quadratic AI supports hundreds of different types of charts, like bar charts, line graphs, scatter plots, pie and donut charts, area charts, heat maps, and combo charts. The AI recommends the most suitable chart type based on your data structure and visualization goals.
Can I customize the AI-generated charts?
Yes. All charts from the AI chart generator are fully customizable. You can modify colors, labels, axes, legends, and other visual elements to match your preferences or brand guidelines.
What charting libraries does Quadratic AI support?
Using Python, Quadratic AI supports Plotly and Pandas. When using JavaScript, Quadratic AI supports Chart.js. Both integrate directly into your spreadsheet so charts update when your underlying data changes.
What does Quadratic AI cost?
Quadratic offers a free tier to get started. Visit our pricing page for details on plans and AI usage limits for teams and enterprises.
Can I share my charts with others?
Yes. Share your charts by inviting collaborators to view or edit the file, or add team members to your workspace. Charts live in the same spreadsheet as your data, so everyone sees the latest version. You can also export your charts as .png files.
How is this different from Excel or Google Sheets charts?
Instead of manually selecting data ranges and chart types, you describe what you want in plain English. Quadratic AI reads your data, picks the right chart, and handles formatting. You also get Python and JavaScript charting libraries for advanced visualizations.
Do I need to install anything to create AI charts?
No. Quadratic runs in your browser — nothing to install and no plugins required. Add your data, open the AI assistant, describe your chart, and get a visualization in seconds.