James Amoo, Community Partner
Mar 26, 2025

A survey by Forbes revealed that data-driven businesses are 23 times more likely to top their competitors in customer acquisition and about 19 times more likely to stay profitable. This emphasizes the power of data in understanding user behavior, analyzing product usage patterns, monitoring feature adoption, and making informed strategic decisions.
Extracting valuable data to enhance user experience and drive revenue can be a lot of work for product managers. This is where product analytics tools become essential. These AI tools help product managers to make data-driven business decisions and improve overall productivity. By using these tools to automate your workflow, product managers can efficiently analyze user data, identify what works, and focus on strategies that drive engagement and boost growth.
As a product manager, recognizing the need for product analytics software is just the first step; choosing the right tool for your project is equally important. With so many options available, finding the best fit can be challenging.
In this blog post, we’ll discuss the 5 best product analytics software solutions, each designed to help you transform data to business decisions with ease. From real-time dashboard creation to AI-powered insights, these tools offer unique features to enhance your analytics strategy.
1. Quadratic
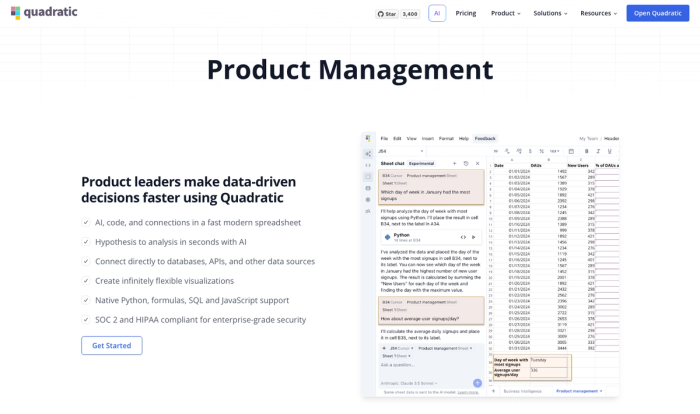
Quadratic is an AI-powered spreadsheet designed to streamline product management analytics and help project managers transform raw data to actionable insights effortlessly. What sets Quadratic apart as one of the best product analytics tools is its speed in generating insights, thanks to its native AI integration. Product managers can use Quadratic AI to gain valuable insights from user data, identify patterns in user behavior, and develop data-driven growth strategies.
It offers a centralized platform to view, analyze, and visualize user data, eliminating the need to juggle multiple tools to achieve the desired analytics result. This allows product managers to focus on strategies that drive product growth rather than manually cleaning, analyzing, and visualizing data. Its familiar spreadsheet interface makes it easy for non-technical product managers to self-serve user analytics.
Beyond AI assistance, Quadratic offers helpful features such as real-time collaboration with team members, direct database connectivity, built-in support for modern programming languages like Python, SQL, and JavaScript, and advanced data visualizations, all while maintaining enterprise-grade security with SOC 2 and HIPAA compliance. Let’s explore these features in detail:
Features of Quadratic
- AI assistance: Whether you’re a technical user or citizen developer, Quadratic’s built-in AI lets you derive insights in seconds by asking questions using simple text prompts. Leveraging LLMs for data analysis reduces the time spent manually analyzing usage patterns and understanding user behavior. It also encourages data-driven decision-making since you gain insights from your data without external factors. Here’s an example:
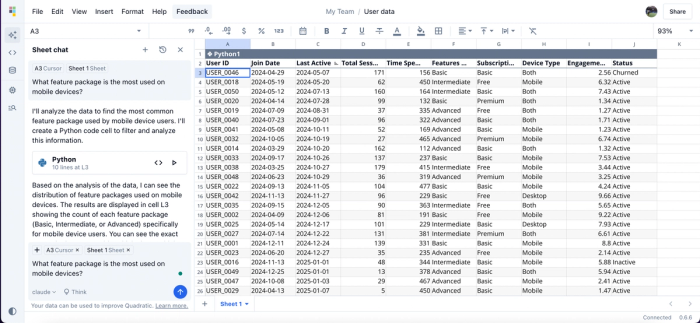
In this example, I generated a sample user data table containing key data points like join date, last active date, engagement score, feature package, and device type. With these data points, I was able to uncover valuable insights pertaining to user behavior. For instance, I asked Quadratic’s AI (Claude 3.7 Sonnet, in this case), "What feature package is most used on mobile devices?". In response, it instantly generated a summary of the output, provided the corresponding code, and created a separate table analyzing the results. Here’s the result:
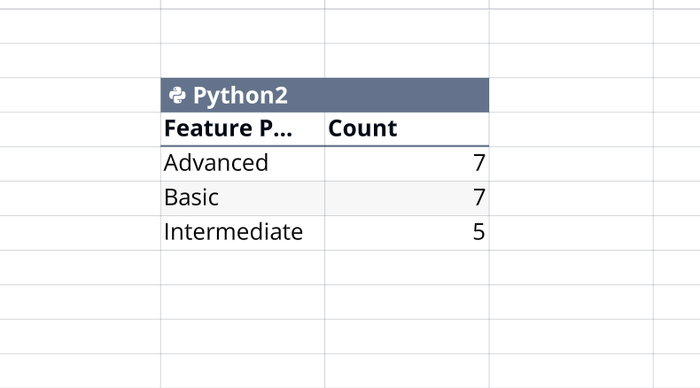
The table shows a breakdown of the feature packages used exclusively by mobile users. Quadratic AI generates Python code for accurate analysis, allowing you to derive a wide range of insights by simply asking questions as though you were having a face-to-face interaction with your data. For instance, if I want to compare user engagement between desktop and mobile devices, I only have to ask.
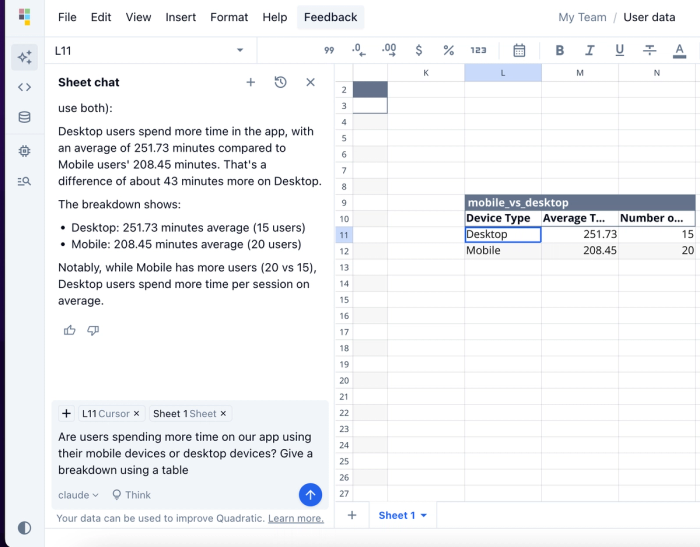
Here, I asked Quadratic AI if users spend more time on the app using their mobile or desktop devices. It compares user distribution across mobile and desktop devices and the average time spent on each device. Learn how you can summarize data tables.
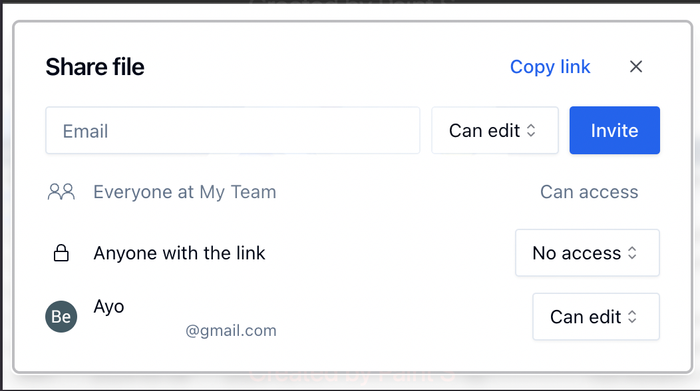
- Collaboration: Quadratic offers a collaborative environment where teams can collaborate in real-time and generate insights simultaneously. You can easily invite other team members and control their access to a particular file.
- Multiple data sources: Quadratic enables seamless integration with databases, APIs, and raw data. You can effortlessly pull data from multiple sources, view it within Quadratic’s interface, analyze user actions, and generate valuable insights from your data. For instance, you can import data from Mixpanel via API into Quadratic to conduct more advanced analyses beyond Mixpanel’s built-in capabilities.
- Data visualization: Visualizations make it easier for product managers to understand their data. With Quadratic AI, you can instantly generate various charts—such as bar charts, scatter plots, line charts, and area charts—based on your data. Let’s see how we can visualize the comparison between mobile users and desktop users based on the total time spent:
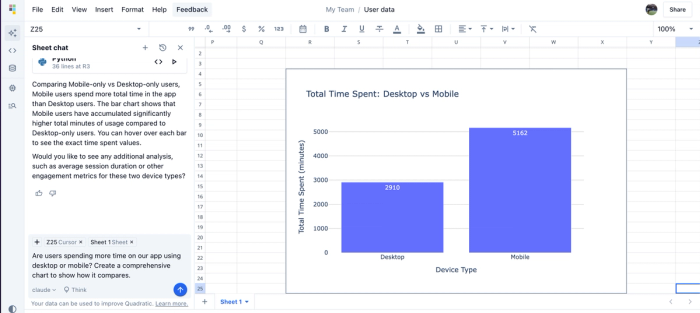
Quadratic AI automatically generates charts based on your text prompts. Simply describe how you want to present your data, and Quadratic will write Python code with built-in Plotly libraries to create an interactive chart.
- Performance: Built on a modern web app architecture, Quadratic delivers high-performance product usage analytics, providing a smooth and responsive experience even when handling large datasets.
- Pricing: Quadratic is free for individuals, with limits to AI prompts you can send. For teams of three or more, a plan is available at $18/month, offering 10-20x higher AI limits, unlimited sharing, and access to a shared team workspace.
2. Mixpanel
Mixpanel is a product analytics tool that provides product managers with real-time insights into user behavior, helping them make more informed decisions with instant access to their data. It enables detailed event tracking, such as button clicks and page views, across both web and mobile applications. It offers a centralized platform that consolidates product analytics metrics such as data views, event tracking, and cross-platform segmentation.
One of Mixpanel’s main drawbacks is its initial setup process, as you have to manually create user events in your application and send them to Mixpanel’s servers for tracking, which could be time-consuming. It has a steep learning curve for beginners, and maximizing certain features may require some expertise.
Mixpanel offers many features, including event tracking, real-time insights, funnel analysis, integration with third-party tools, and session replays. Let’s discuss some of these features:
Features of Mixpanel
- Detailed event tracking: Mixpanel enables tracking of user interactions such as button clicks, form submissions, and page views. Product managers can analyze actions that drive the most engagement from users and leverage that accordingly.
- Real-time insights: Product managers can access real-time dashboards and reports and identify usage patterns instantly.
- Session replays: This feature allows you to watch session replays of individual users, providing more context into user actions and helping to identify what truly drives user events.
- Integrations: Mixpanel integrates with platforms such as Quadratic, Google Cloud, Zoho, and Zapier.
- Pricing: Mixpanel offers a free plan with a limit of 1 million monthly user events. For usage beyond this, the paid Growth plan charges $0.00028 per event.
3. Amplitude
Amplitude is a leading product analytics tool that offers deep insights into user behavior, helping businesses make tailored decisions for product growth. It is known for its user segmentation and behavioral cohorts, which segment users based on their actions on the app and engagement score. Product managers can better understand their users’ journey with instant visualizations, automated reports, and real-time insights.
Amplitude’s product analytics dashboard allows tracking of key growth metrics such as conversion, retention, and engagement. Given its steep learning curve and wealth of features, Amplitude is often perceived as an overkill for small teams that are only looking to track basic user events. To flatten the learning curve, it offers some built-in customizable analytics templates, allowing product managers to access key metrics instantly. Amplitude users can also integrate their data with Quadratic for additional insights.
Features of Amplitude include behavioral cohorts, retention analysis, funnel analysis, event segmentation, and session replays. Let’s discuss some of these.
Features of Amplitude
- Behavioral cohorts: This feature identifies users with similar behavior and automatically groups them into a cohort. This helps to easily connect user behavior to specific business outcomes.
- Session replay: Amplitude allows product managers to integrate session replay into their applications, providing a comprehensive view of user behavior. This helps to identify friction and optimize user experience.
- Retention analysis: This feature provides product managers with insights into their active users, helping them understand how frequently they return and the reasons behind their engagement. It also offers strategies for identifying the most relevant retention metrics tailored to a specific business.
- Funnel analysis: Amplitude’s robust funnel analysis feature provides insights into your product’s onboarding funnel, helping product managers identify drop-off points and how they can optimize conversion rates.
- Pricing: Amplitude offers a free plan with limited features, while its paid plan for small teams starts at $49 per month(billed annually).
4. Heap
Heap is a product analytics software renowned for its automatic data capture, which records all user interactions on a website or app without requiring manual setup. Unlike Amplitude and Mixpanel, which need technical configuration for event tracking, Heap automatically tracks user actions such as button clicks, form submissions, and page views.
This automation provides quick access to analytics for product managers without additional setup. Heap also offers advanced data science capabilities, which enable teams to uncover friction points in user behavior. Similar to Quadratic, Heap is relatively easy to use, thanks to its automatic data capture feature. It integrates with platforms such as Salesforce, HubSpot and Shopify.
Its key features include session replay, funnel analysis, heatmaps, user cohorts, and customizable charts. However, its chart customization options are somewhat limited compared to other tools.
Features of Heap
- Automatic data capture: Heap’s automatic data capture feature eliminates the need for manually tagging user events, which saves time and improves productivity.
- Heap Illuminate: Heap offers a data science layer that allows product managers to analyze users’ behavioral data and automatically generate all sorts of insights, including actions they haven’t been following. This feature is called Heap Illuminate.
- Heatmaps: Heatmaps enable product managers to get visual insights into what users engage with and what they ignore, with no manual event creation or tagging required.
- Cohorts: Like Amplitude, Heap also allows product managers to create user cohorts based on the actions they take on their website or app.
- Pricing: Heap offers a free plan that offers up to 10,000 monthly sessions. For additional features(such as chart customization and email support), it provides paid plans, but pricing varies based on the number of user sessions. To get an exact estimate, users must sign up for a quote.
5. Google Analytics
Google Analytics is a popular player in the product analytics game as it remains the de facto application for analyzing user activity on websites and apps. It provides valuable metrics such as page views, conversion rates, user locations, and per-click data. With Google Analytics, product managers can gain insights into where their users come from and the devices they use.
While Google Analytics performs excellently in tracking website traffic and funnel metrics, it falls short in the aspect of user behavior analysis. Unlike other product analytics tools, it does not offer features like session replays, user journeys, or heatmaps. As a result, product managers cannot fully understand how users interact with their products unless they integrate Google Analytics with additional session replay tools.
Product managers seeking a comprehensive insight into what is happening on their website will find Google Analytics highly valuable. However, for deeper insights into why and how users behave, other analytics tools with advanced in-app event tracking may be more suitable. Key features of Google Analytics include traffic analysis, real-time analytics, predictive capabilities, funnel analysis, and seamless integrations with various platforms.
Features of Google Analytics
- Real-time analytics: Changes to user data happen in real-time. Google Analytics allows you to monitor activity on your website or app as it happens.
- Predictive capabilities: Google’s machine learning models provide product managers with predictive insights into user behavior, allowing them to anticipate future actions and tailor data analytics strategies for specific audiences. This sets the foundation to optimize conversion rates and enhance customer retention.
- Traffic analysis: This feature helps you easily identify where your visitors are coming from, whether through search, direct traffic, paid ads, or social media. It also provides insights into which channels need better marketing efforts to drive more engagement.
- Integrations: Google Analytics is known for its seamless integration with various platforms, including those within the Google ecosystem (Google Ads, Google Optimize, Google BigQuery), BI tools (Power BI, Tableau, Looker), and CRMs (HubSpot, Salesforce).
- Pricing: Google Analytics offers a free version that includes core features, which makes it the most cost-effective solution for most businesses. It also has a paid version of $50,000 annually that comes with more advanced features.
Summary: Choosing the best product analytics software
Data analytics for product managers is essential for driving growth and making data-driven decisions. In this blog post, we explored five analytics tools for product managers. Each tool has its strengths, and choosing the best product analytics software depends on your specific needs. Here’s a summary to help you make the right choice:
- For detailed in-app event tracking and deeper insights into user behavior, choose Mixpanel or Amplitude.
- For a friendlier platform with automated data capture and effortless event tracking, Heap is the best option.
- For a cost-effective solution with real-time analytics and comprehensive traffic analysis, Google Analytics stands out.
- For AI-powered product data analytics, a familiar spreadsheet interface, real-time collaboration, direct connection to multiple data sources, and advanced data visualizations on your user data, Quadratic is the ideal choice.
Ready to experience the future of analytics and make data-driven decisions for your business or product? Try Quadratic for free today.