James Amoo, Community Partner
Apr 22, 2025

According to a study by the Aberdeen Group, companies that use visual data discovery tools are 28% more likely to find timely information. As datasets grow in size and complexity, interpreting raw data becomes increasingly challenging. This underscores the importance of data visualization in the data analytics lifecycle and how it helps to bridge the gap between data fluency and data literacy.
Now, transforming data into meaningful visuals is not as straightforward as it seems. It requires a solid understanding of your data and, in some cases, familiarity with coding. This is where data visualization tools come in. With many free data visualization tools out there, choosing the best data visualization software for your projects could be the key to effectively communicating insights to relevant stakeholders and making informed decisions.
In this blog post, we will discuss the 10 best data visualization tools for your projects, ranging from no-code dashboards to visualization tools that offer AI-driven suggestions, code support, and real-time collaboration for better storytelling.
What is data visualization?
Data visualization is the process of turning complex data into clear, visually appealing formats. Depending on the use case, these visual formats could come in various forms. Common formats used to visualize data include charts, infographics, graphs, and diagrams.
By transforming raw numbers into clear narratives, data visualization empowers analysts to better understand their data and uncover insights faster.
Data visualization tools help analysts to streamline the process of creating visual representations of complex datasets. These tools not only simplify the creation of interactive visuals but also reveal patterns, trends, and insights that might be overlooked in raw or textual data.
Why is data visualization important?
While data visualization enhances the visual appeal of your data, its importance goes far beyond aesthetics. Let’s explore some other benefits of data visualization:
- Better communication: Visual content is better understood by analysts and easily communicated to both technical and non-technical stakeholders.
- Self-serve analytics: When data is easily understood, team members can effectively self-serve analytics, eradicating slow decision-making and promoting a data-driven culture in organizations.
- Faster insights: Data visualization accelerates the path to generating actionable insights from data, as less time is spent on interpreting complex data.
- Efficient data analysis: Data analysts can quickly identify trends and patterns in visualizations that might not be evident in raw or tabular data.
1. Quadratic
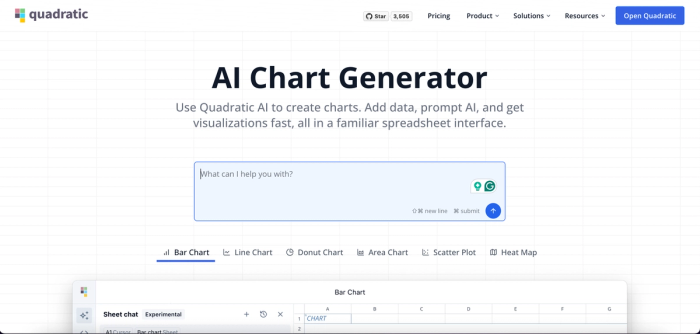
Quadratic is an AI-powered spreadsheet that enables you to visualize your data by passing natural language queries to its built-in AI, allowing you to transform raw data into interactive visualization in seconds. All you have to do is describe how you want to present your data, and Quadratic AI will generate Python code to visualize your data using built-in Plotly libraries.
It supports various types of charts, including bar charts, pie charts, area charts, line graphs, scatter plots, and more. It also recommends the most suitable chart type based on your data. Quadratic provides support for modern programming languages like Python, SQL, and JavaScript, allowing users to write and execute code within the spreadsheet. It supports Plotly when using Python and Chart.js when working with JavaScript.
Unlike other software that may require integration with third-party tools to create interactive charts, Quadratic provides a unified platform to view, analyze, and visualize your data, making it one of the best AI data visualization tools. This reduces the time spent juggling multiple tools to achieve your desired result.
Features of Quadratic
Quadratic offers a variety of features that help data analysts to easily create interactive visualizations, making it the best free data visualization software. Let’s explore some of these features:
- Multiple data sources: Quadratic connects directly with multiple databases, APIs, and raw data. Simply import your data into Quadratic, then use natural language to describe the chart you want to create.
- Customizable visualizations: Quadratic’s AI-generated data visualizations are highly customizable. You can modify colors, labels, axes, and other visual elements to match your preference.
- AI assistance for analysis: Whether you’re a technical user or citizen developer, Quadratic AI allows you to leverage LLMs for faster insights, reducing the time spent on manual data analysis. It helps to streamline tasks like summarizing data tables, generating sample data, and analyzing CSV data.
- Easy to use: Seamlessly create interactive charts without coding knowledge or heavy technical expertise. Quadratic’s intuitive interface makes it appealing to users of varying skill sets.
- Collaboration: Quadratic provides a collaborative environment that allows you to share your charts with team members by inviting them to view or edit the file.
- Performance: Built on the modern web app architecture, Quadratic’s chart generation is fast and highly performant, providing a smooth and responsive experience while creating interactive charts.
Step-by-step: How to visualize data in Quadratic
As we mentioned earlier, data visualization in Quadratic is relatively easier, and it caters to users of all skill sets. Here’s a step-by-step guide on how to visualize data in Quadratic:
Step 1: Sign up for Quadratic (free)
Head over to Quadratic and create a free account.
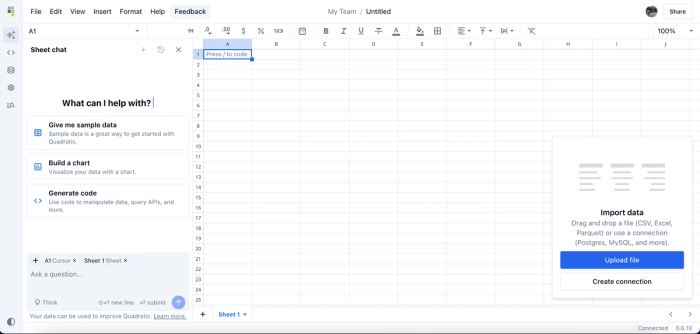
Step 2: Import your data
The next step is to import your data. Simply click the “Upload File” button located at the bottom-right corner of the spreadsheet interface. You can upload files in CSV, Excel, or Parquet formats, or import a PDF. Alternatively, you can connect to a cloud storage location via a Python API request.
Here’s how it looks after successfully importing the data:
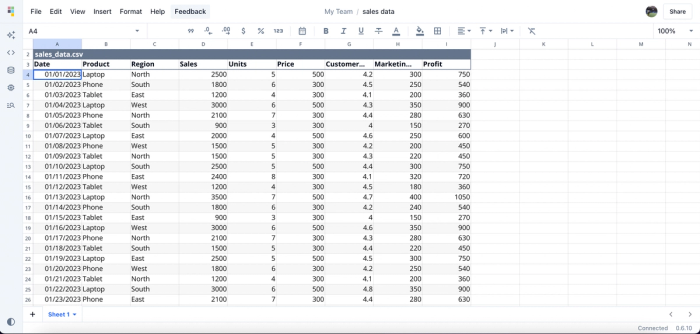
Step 3: Create charts using text prompts
The next step is to visualize our data. You can do this easily by describing the desired visualization using natural language. Since we’re working with sales data in this guide, let’s create a chart that compares sales performance across all regions:
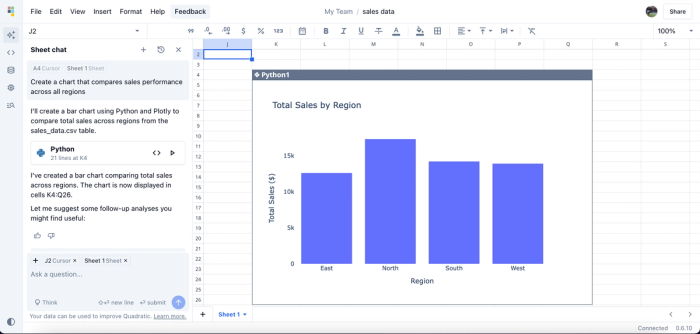
Here, Quadratic AI generates a bar chart based on the text prompt, visualizing sales performance across all regions. At a glance, we can see that the North region outperforms the others. We can further refine the chart to get our desired result. For instance, we can sort the bars in descending order:
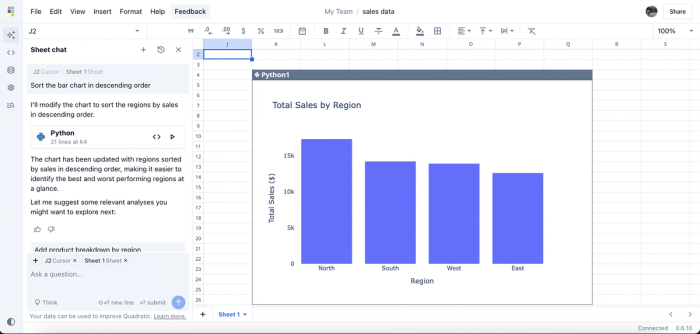
By updating the prompt, we now have our chart in descending order, making it easier to understand and interpret the sales performance across all regions. You can create additional visualizations based on this sales data, such as product performance comparison, sales trend over time, and more.
2. Tableau
Tableau is a data visualization software that enables users to create interactive and dynamic visualizations. It supports a wide range of chart types, including bar charts, line graphs, and maps. Tableau seamlessly connects to various data sources, allowing you to easily import and work with your data. Backed by an extensive community of users, it offers a wealth of resources for learning and support.
Tableau has different versions, including a desktop app, server, and web-based options. It also offers a free software for data visualization but comes with limited features. One of the main drawbacks of Tableau is the high cost of its paid versions, which can be a barrier for individuals or smaller organizations.
Features of Tableau
- Multiple data sources: Tableau provides seamless integration with hundreds of data sources.
- Real-time data updates: Tableau automatically reflects any changes made to connected data sources in real time, ensuring that visualizations stay updated.
- Easy-to-use: Tableau’s user-friendly interface appeals to users of all skill sets. Its drag-and-drop feature makes it easy for users to create interactive visualizations.
- Collaboration: Users can share dashboards and visualizations via Tableau Server, Tableau Online, or Tableau Public.
3. Power BI
Microsoft Power BI is a business intelligence and data visualization software that enables users to transform raw data into interactive and visually compelling dashboards. It integrates seamlessly with other Microsoft tools such as Excel, Azure, and SharePoint.
Compared to Tableau, Power BI offers more affordable pricing, making it a popular choice for businesses of all sizes. One drawback of Power BI is its learning curve, as fully leveraging its advanced features requires some level of technical expertise. Explore the best alternative to Power BI and Tableau.
Features of Power BI
- Integration with Microsoft tools: Power BI integrates seamlessly with other tools in the Microsoft ecosystem, including Excel, SQL Server, and Azure.
- Power Query Editor: This built-in Power BI feature allows users to clean their data before visualization.
- AI-powered insights: Leverage AI to enhance analysis by detecting patterns and trends in your data.
- Multiple data sources: Power BI provides an easy connection with hundreds of data sources.
4. Qlik Sense
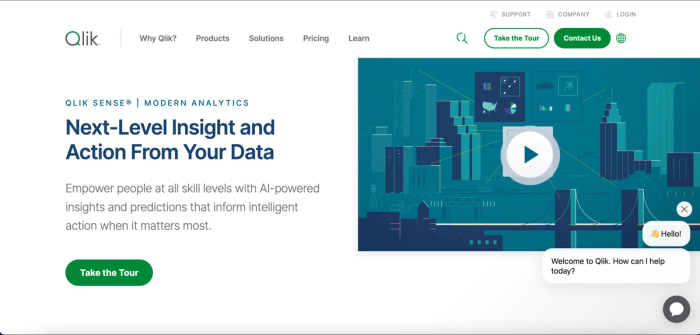
Qlik Sense is a data analytics and visualization platform that offers advanced data visualization features and access to your data from any internet-connected device. Its associative data engine allows users to uncover hidden relationships in their data that other tools might overlook. This makes it one of the best data science visualization tools to use. It is also capable of handling large and complex datasets without performance bottlenecks. A major drawback of Qlik Sense is its complex and costly initial setup.
Features of Qlik Sense
- Associative data model: This feature provides multiple perspectives to explore your data, allowing you to uncover hidden trends and reach insights faster.
- Interactive dashboards: Users can build and interact with dashboards that provide an immediate response to user input.
- Customization: Qlik Sense provides extensive customization options for creating charts and dashboards.
- Self-service analytics: Its drag-and-drop feature makes it easy for users to create interactive charts and dashboards.
5. Domo
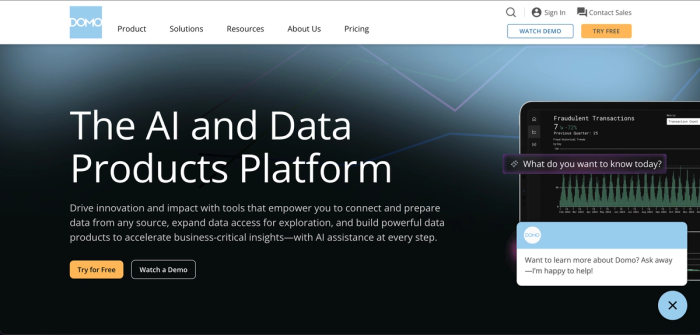
Domo is a cloud-based business intelligence tool that allows you to create real-time dashboards and interactive charts based on your data. It is widely accessible across various devices as it connects all your business intelligence to your phone, immediately providing alerts on updates to your data. Compared to other tools, Domo lacks advanced data visualization capabilities.
Features of Domo
- Cloud-based: It operates completely on the cloud, which means it is easily accessible.
- Real-time visualizations: Domo provides users with real-time data visualizations, allowing you to see how your charts and dashboards automatically update with changes in data.
- Mobile-first philosophy: Domo’s mobile-first philosophy allows users to fully access dashboards and visualizations right from their mobile phones.
- Multiple data sources: Domo provides native integrations with over 1000 data sources, including tools like Salesforce, Excel, MySQL, and Google Analytics.
6. D3.js
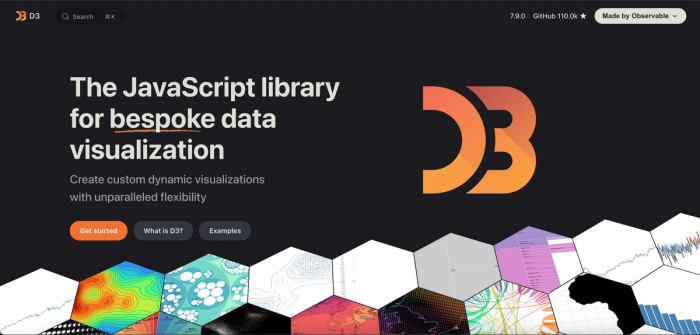
D3.js (Data-Driven Documents) is a JavaScript library that allows developers to transform raw data into beautiful, interactive visualizations. It’s renowned for its flexibility and customization, giving developers full control to customize every aspect of the visual output. D3 operates by binding data to DOM elements and then manipulating selected nodes. It uses HTML, SVG, and CSS to create visualizations from data.
Features of D3.js
- Flexible customization: D3.js offers developers full control of their visualizations.
- Animation: It includes built-in support for animations and transitions, enhancing the visual experience and making data interactions more engaging.
- Real-time updates: Developers can see updates to their visuals in real time without needing manual refresh.
- Scalability: D3.js supports large amounts of data, making it suitable for businesses of all sizes.
7. Sisense

Sisense is a modern data analysis and visualization software built to analyze and efficiently visualize data. Thanks to its in-chip data processing, it can handle high volumes of data without performance issues, enabling users to create interactive visualizations without lag. Its intuitive interface makes it easy for users with minimal technical knowledge to create dashboards and reports.
Features of Sisense
- AI analytics: Sisense offers AI-driven analytics that enable users to get quick insights from their data and gain a better understanding through their visualization.
- Customizable visualization: Visualizations in Sisense are highly customizable, allowing users to easily achieve their desired results.
- Ability to handle large datasets: Users can analyze and visualize large datasets without worrying about performance.
- Scalability: It is easy to scale, making it ideal for small and large businesses.
8. Zoho Analytics
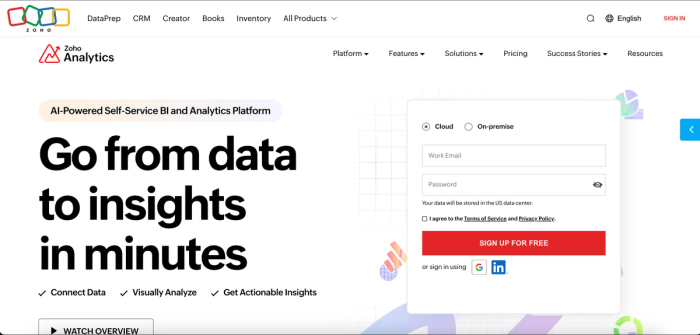
Zoho Analytics is a data analytics and visualization tool that offers a comprehensive solution for turning raw data into visual formats. It connects with over 250 data sources, also integrating seamlessly into the Zoho ecosystem of business applications. Users can easily create interactive dashboards and share them with team members. It also provides a drag-and-drop feature that streamlines the creation of dashboards and reports. Zoho Analytics is cross-platform, available on Windows, macOS, and Linux.
Features of Zoho Analytics
- Supports various charts: Zoho Analytics supports a wide range of charts, including bar charts, line charts, and heatmaps.
- Drag-and-drop: Users can easily build dashboards and reports with its drag-and-drop interface.
- AI-powered insights: Users can generate insights automatically through natural language queries, fostering AI-driven business intelligence.
- Integrations: Zoho Analytics connects with over 250 data sources, allowing users to visualize data from multiple platforms.
9. Plotly
Plotly is an open-source data visualization library designed for developers to create highly interactive visualizations using Python, R, or JavaScript. Unlike no-code or low-code tools, Plotly requires a certain level of coding expertise to build and customize visual outputs. Quadratic supports Plotly, which means users can leverage its visualizations without writing a single line of code. While it excels in producing high-quality charts, performance can become an issue when handling large datasets.
Features of Plotly
- Support for multiple programming languages: Like Quadratic, Plotly supports multiple programming languages, including Python, R, and JavaScript.
- Supports various charts: Plotly supports a wide range of charts, including bar charts, line charts, heatmaps, geographical maps, and treemaps.
- Interactive visualizations: Plotly allows users to create interactive and highly customizable visualizations.
- High-quality visuals: Users get to work with high-quality, publication-ready visuals that are ready for presentation right out of the box.
10. Chart.js
Chart.js is a lightweight, open-source JavaScript library designed to create charts on the web. It supports various types of charts, including bar charts, line charts, and pie charts. Chart.js utilizes HTML5 Canvas to render charts, ensuring smooth performance across all modern browsers. The charts created are responsive by default, ensuring they adapt to different screen sizes and devices. While it requires JavaScript knowledge to use, Quadratic’s support for Chart.js enables users to build charts effortlessly without writing any code.
Features of Chart.js
- Responsive design: Charts created are fully responsive on all devices without additional configuration.
- Animations: Charts.js includes built-in animations and transitions, enhancing the visual appeal of charts.
- Flexible customization: Users can customize every aspect of the charts created, including colors, fonts, labels, and animations.
- Performance: Its lightweight nature enables quick and efficient chart creation, making it easy to render charts without lag.
Conclusion
Choosing the best data visualization software for your projects is crucial for understanding your data, generating faster insights, and communicating your data to relevant stakeholders.
In this blog post, we explored the best 10 visualization software, ranging from no-code platforms to charting libraries. The best tool for data visualization should offer a wide variety of chart types, AI-powered insights, seamless integration with multiple data sources, extensive customization, and collaboration features. Above all, the right visualization tool should bring users closer to the future of data analytics.
Having explored the top data visualization tools, Quadratic stands out as the best visualization software, satisfactorily checking all the boxes. Feel free to try it out today and embark on your journey of creating interactive visualizations.


