
James Amoo, Community Partner
Apr 4, 2025

Whether you're unsure how to extract insights from your CSV data or looking for a faster way to do it, this blog post is for you. Comma Separated Values (CSV) is a common data file format for storing and exchanging tabular data. As the name implies, it consists of individual data separated by commas.
Its lightweight nature makes it the preferred file format for many people working with data online, so it’s beneficial to know how to handle CSV data and ultimately generate insights from it. Ordinarily, CSV is just a file format for storage; it requires CSV editors to view, analyze, and perform complex actions.
While most spreadsheet applications support CSV, they often come with limitations such as row limits, slow performance, and integration with other tools to achieve your desired goal. To analyse CSV data quickly, you need an all-in-one platform that enables seamless viewing, manipulation, analysis, and visualization.
In this blog post, we’ll explore how Quadratic, an AI-powered spreadsheet platform, simplifies CSV data analysis—from generating quick summaries to creating interactive visualizations.
What does it really mean to analyse CSV data?
You have a CSV file, now what? How do you transform raw data into actionable insights through analysis? The answer to this question lies in understanding what it means to analyse CSV data and all the processes involved.
Understanding the data analytics lifecycle is necessary for extracting actionable insights from your CSV data. The process involves several key steps: importing your data (data collection), cleaning, analyzing, optionally visualizing for better understanding, and making informed decisions based on the insights gained.
While this journey isn't always straightforward, Quadratic simplifies and accelerates the process by offering a centralized platform where you can seamlessly perform all these tasks, eliminating the need for combining multiple tools.
Why is Quadratic the best tool for analyzing CSV data?
While platforms like ChatGPT offer AI-powered assistance for CSV analysis, they lack a comprehensive solution for other key aspects, such as easy viewing, visualization, and collaboration.
This means that even if you choose to analyze CSV data with ChatGPT, you’ll still have to combine other tools to achieve your desired goal. In addition to providing an all-in-one platform to analyze CSV data, Quadratic also provides other helpful features:
- Easy data collection: Simply upload or drag and drop your CSV file into Quadratic, and it’s instantly ready for analysis.
- AI-assistance: Derive insights from your CSV data by asking questions in plain English, irrespective of your level of technical expertise. Quadratic supports multiple LLMs like GPT-4o, Claude 3.7 Sonnet, and more.
- Real-time collaboration: Collaborate with team members and simultaneously make edits to your CSV data.
- Native code support: Need to perform advanced analysis on your CSV data beyond what formulas can offer? Quadratic’s integrated code editor lets you write or generate Python, SQL, and JavaScript code.
- Data visualization: Describe how you want to present your data, and Quadratic writes Python code with built-in Plotly libraries to create an interactive visualization.
- Performance: Analyze your data without performance bottlenecks or lags. Built on modern web architecture, Quadratic delivers a fast, smooth, and responsive experience.
- Security & compliance: Quadratic is SOC 2 and HIPAA compliant, ensuring top-tier security for your sensitive data. It’s free for individuals, with paid plans available for teams and enterprises offering additional features like self-hosting and higher AI limits.
Step-by-step: how to analyse CSV data in Quadratic
1. Sign up for Quadratic
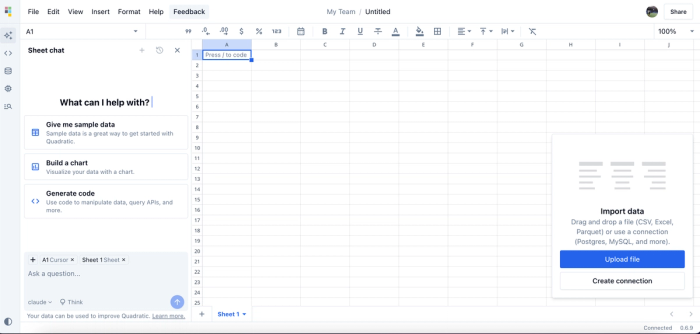
First, sign up for Quadratic and open a free account. Once you’re in, you’ll see a familiar spreadsheet interface, which is where we will perform our CSV data analysis. Quadratic is browser-based, enabling users to analyze CSV file online without requiring manual installation.
2. Import your CSV file
Next, click the "Upload File" button in the bottom left to import your CSV. You can upload it from your computer, drag and drop it, or connect to a cloud storage location via a Python API request.
Here’s how it looks after I import the CSV file:
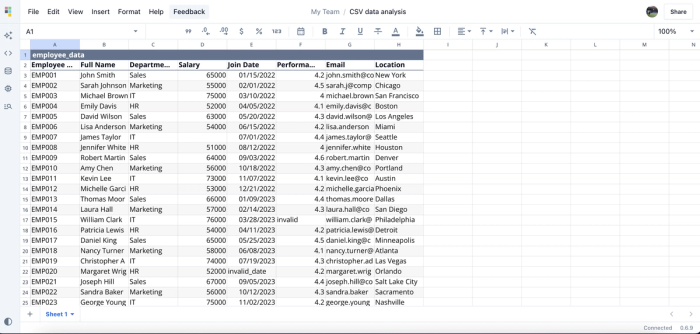
You'll notice some inconsistencies in this employee data, such as empty values, wrong values, and wrong date formats. No worries, Quadratic provides an easy way to clean and fix them.
3. Clean CSV data
Dirty or stale data can negatively impact analysis, so the next step is to clean your CSV data. Rather than manually scan for inconsistencies or write Python scripts for automation, we can use Quadratic AI to clean our data by passing text prompts.
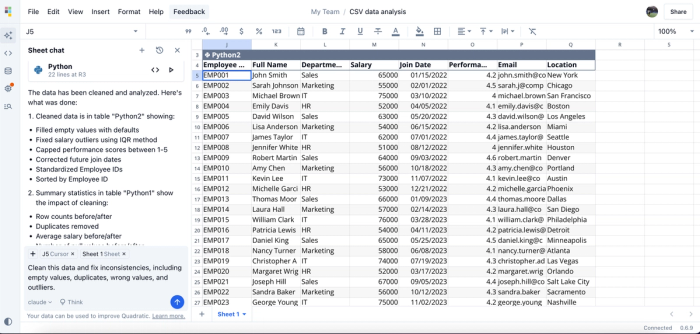
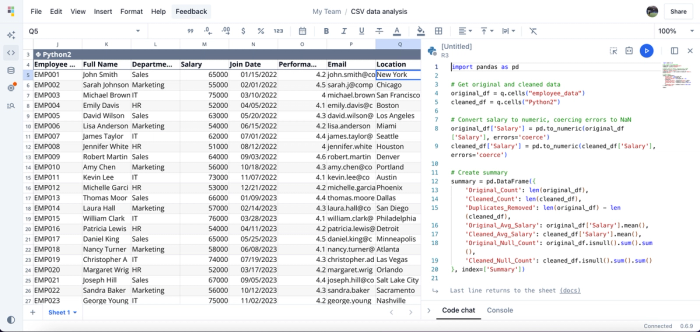
I asked Quadratic AI (Claude 3.7 Sonnet model in this case) to clean the data and fix inconsistencies. It generated a separate table with corrected values and provided corresponding Python code, which you can review and edit. You do not need to know how to analyze CSV data in Python, Quadratic helps to generate the Python code.
4. Analyze data
After cleaning your data, the next step is analysis to extract key insights. You can manipulate your data using traditional spreadsheet formulas, write code in Python or JavaScript, or simply use Quadratic AI, which is the fastest option. We'll be using Quadratic AI to analyze our CSV data.
For example, if I want to find out which department pays the highest average salary, I just have to ask. I asked Quadratic AI, “Which department has the highest average salary? Here is the result:
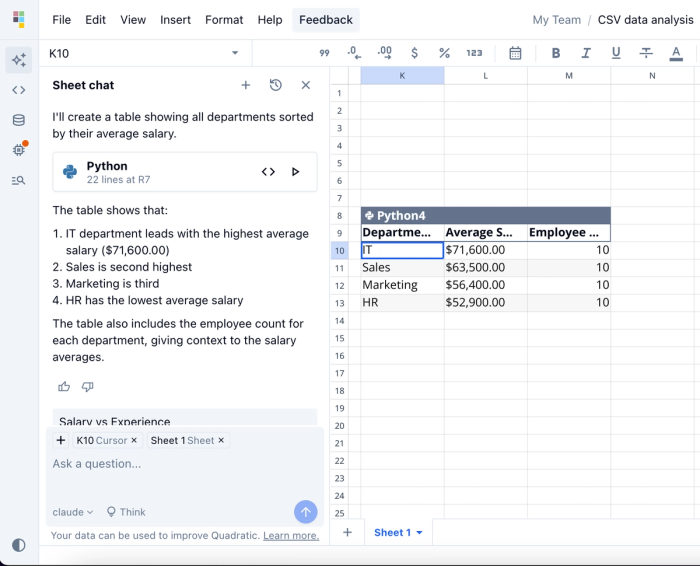
This summary table is a simplified substitute to manually creating pivot tables like you would in Excel. The table shows that the IT department has the highest average salary. It also provides a breakdown of salary ranges across other departments and the number of employees. Let's see how we can also identify the employees with the longest tenure at the company:
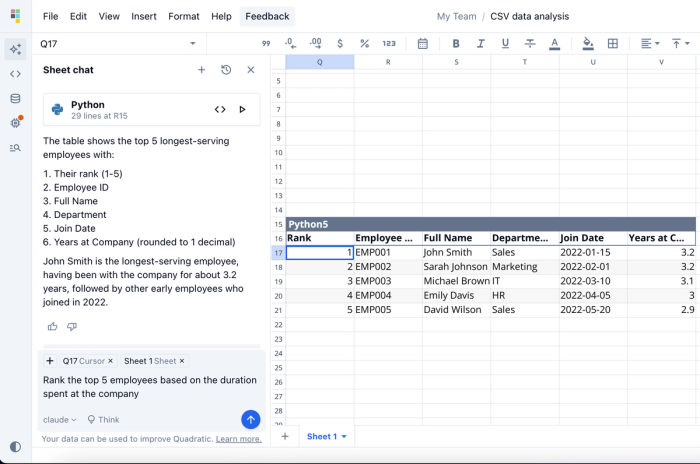
It generates a table ranking the top five employees by tenure, along with the exact number of years each has been at the company.
With Quadratic, you simply ask questions about your data, and it generates the Python code, allowing you to gain key insights instantly.
5. Visualize your data
CSV data visualization makes it easier to understand your data. With Quadratic, you can generate various interactive charts without having to write complex Python code or manually configure charts from a pre-selected list. Quadratic eliminates the need for juggling multiple CSV visualization tools as it allows you to visualize your CSV data with minimal effort.
Let’s create a chart to visualize the average salary distribution across the departments.
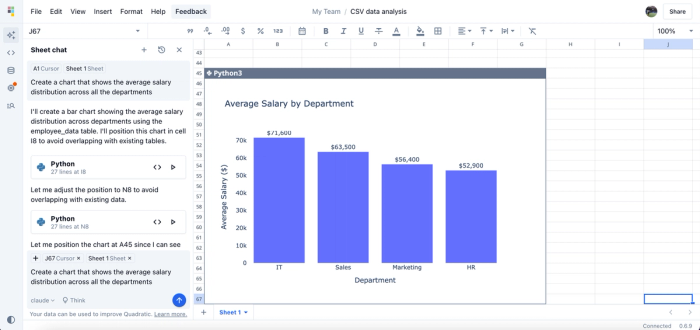
Quadratic AI instantly generates a bar chart that shows the average salary distribution by department. Simply describe how you want to present your data, and Quadratic will automatically generate Python code using built-in Plotly libraries.
6. Generate summaries
When working with large CSV files, getting summaries on specific data points can be time-consuming. With Quadratic, you can instantly summarize your data table by simply entering text prompts. Let’s see how we can get a concise summary table of the best-performing employees by their departments:
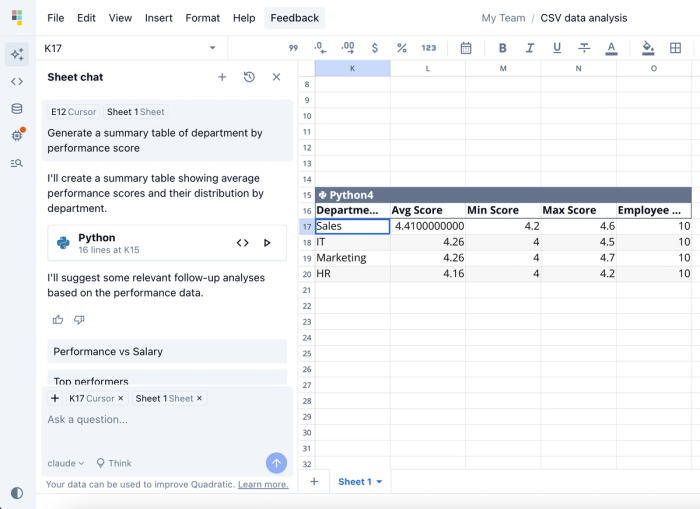
Summary tables are great for quickly extracting key insights without extra effort. From this table, we can see that while the best-performing employee is from the Marketing department, most of the high-performing employees are from the Sales department, as they have the highest average score. Detailed breakdowns like this are crucial for uncovering insights that might be overlooked with manual analysis.
Analyse CSV data with ease. Try Quadratic for free today
Whether you’re a citizen developer or a technical user, turning raw data into actionable insights is easier than you think. In this blog post, we saw the transformation of raw CSV data into actionable insights, all from a single location. Quadratic offers a CSV analyzer platform to view, clean, analyze, and visualize your data effortlessly.
Ready to experience the future of data analytics? The first step is to sign up for Quadratic. After that, you import your CSV file and use its intuitive spreadsheet interface to analyse CSV data quickly and efficiently. Working with Parquet files? Learn how to use the easiest online Parquet file viewer.


