MJ Lindeman, PhD, Community Partner
Feb 28, 2025

The question of how to summarize spreadsheets with ChatGPT has become one of the most searched queries in data analysis, showing how many professionals are seeking a more efficient solution. While learning how to summarize a data table is a fundamental skill, the traditional copy-and-paste approach to AI spreadsheet analysis creates more problems than it solves.
For example, when the AI model is embedded in a spreadsheet, no copying is required. Quadratic AI provides a new, faster way to summarize a data table by prompting an AI model using natural language. You can ask the AI to do tasks in any of the analysis steps, such as data preparation, suggesting and doing one or more analyses, and refining an analysis when that is needed.
Contrast using an AI with the normal cut-and-process. You may have uploaded an existing table to have ChatGPT edit it, and then experienced a frustrating cycle of switching between windows, reformatting text, and carefully pasting responses back into your workflow. This process is slow and may introduce errors or compromise data security. The process may even obscure the actionable insights that are your ultimate goal.
Today’s business environment is rapidly changing, and quickly deriving insights from data is critical for success. No matter what you are analyzing, whether it is quarterly sales figures, tracking marketing campaign performance, or analyzing customer-experience data, rapid and accurate data summarization directly impacts decision-making quality. Companies can quickly transform raw data into actionable insights to gain a significant competitive advantage.
Consider these common scenarios where quick data summarization proves invaluable:
- Financial analysts need to spot trends across thousands of transactions
- Marketing teams must understand campaign performance across multiple channels
- Product managers require quick insights from customer feedback data
- Sales teams need to identify top-performing regions and products
Large language models (LLMs) like ChatGPT have revolutionized how we approach these challenges. Instead of spending hours manually reviewing and summarizing data, AI can now process vast amounts of information in seconds. It identifies patterns and insights that might otherwise go unnoticed. However, the real breakthrough is how seamlessly we can access these capabilities.
In this post, you will learn how to transform your data analysis workflow using Quadratic's integrated AI capabilities. We will explore how the right tools can turn hours of manual data review into minutes of focused analysis.
Why traditional manual data analysis falls short
Think of the last time you needed to summarize a complex data table. Before you can even begin the actual analysis, spreadsheet preparation consumes precious time. You find yourself cleaning messy data, standardizing number formats, removing irrelevant columns, and ensuring text fields are consistent. What should be a quick analysis turns into hours of preparatory work just to make your data presentable enough for AI tools to interpret it correctly.
Once your data is clean, the real challenges begin. Since most AI tools have character limits and specific formatting requirements, you often need to break your data into smaller chunks. This means carefully copying and pasting sections of your spreadsheet into ChatGPT or similar AI tools, and repeatedly checking to ensure no data becomes misaligned or corrupted in the transfer process. Each paste operation requires careful formatting checks. For example: Are your column headers still aligned? Did any numbers convert to dates unexpectedly? Did any crucial decimal points disappear?
Perhaps the security and version control issues this approach creates are your highest concerns. Each time you copy sensitive business data into an external AI tool, you are potentially exposing confidential information. Meanwhile, as you accumulate AI-generated insights, keeping track of which analysis corresponds to which dataset becomes increasingly complex. You might find yourself creating multiple versions of the same document, each with different segments of analyses, leading to confusion about which version contains the most current insights.
These manual processes, aided by an AI outside the spreadsheet, introduce three critical vulnerabilities:
- Data integrity risks from repeated copying and reformatting
- Security concerns when sensitive information leaves your secure environment
- Version control challenges as analyses multiply across different documents and tools
The Quadratic approach is seamless AI integration
Quadratic transforms spreadsheet summarization from a complex juggling act into a straightforward conversation with your data. Your results depend on your optional choice of AI model to use.
You will immediately notice the familiar spreadsheet interface with the summary table on the right side (similar to a pivot table in Excel). The Chat column on the left shows the user input and the AI response.
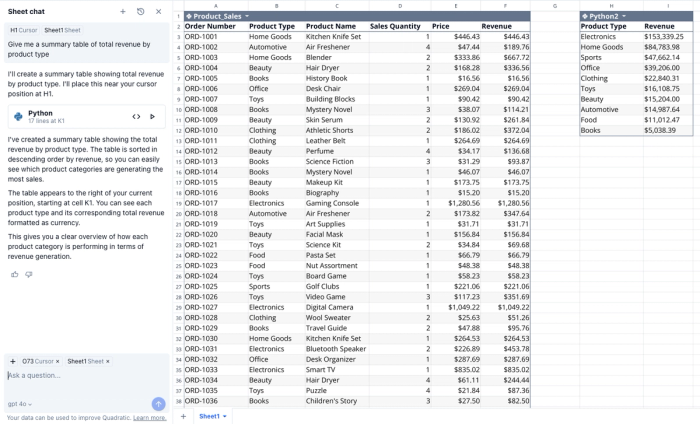
However, there are some powerful differences. Unlike traditional spreadsheets that require careful data preparation, Quadratic welcomes your data in whatever form it arrives. You can simply drag and drop your CSV, Parquet, or Excel files, connect directly to your database, or open an existing Quadratic spreadsheet. The platform automatically handles formatting and structure, preserving your data's integrity without requiring manual cleanup.
Once your data is in place, interacting with the AI is straightforward, especially since the built-in AI has the context of your entire spreadsheet. Here's where the magic happens. Instead of copying and pasting data, you can directly ask the embedded AI model to analyze your spreadsheet. For example, if you're looking at sales data, you might type: "Summarize the sales data focusing on the top-performing products in Q4.”
The summary table or data visualization you requested appears within your spreadsheet interface. You do not need to switch between windows or copy results back and forth. What's particularly powerful is the ability to iterate on these insights. Want to dig deeper? Simply ask follow-up questions like "Add historical growth trends over the past three quarters" or "Compare these results to last year's performance." Each refinement builds on the previous analysis, and this progression provides a comprehensive understanding of your data.
Pro tips to maximize your AI-powered analysis
Any AI system is a hybrid mix of human and machine characteristics. If you interact with it as either of them rather than a mixture of both, you will experience problems, and you will not unlock the full potential of Human-AI collaboration. The key is understanding how to communicate with an AI because it uses and understands natural language, but it requires being precise in your prompts.
Understanding how to communicate effectively with an AI can dramatically improve the results of your data analysis. An AI makes inferences and ‘thinks’ about what you say in ways that a normal computer cannot. On the other hand, you cannot assume an AI will infer what you do not explicitly express in words. If you assume the AI has the same inference capability as humans, you will experience problems when it misunderstands.
Crafting effective prompts
The key to getting precise, actionable insights lies in how you frame your questions to the AI. The more context and details you provide, the better your results will be. For example, you could ask, "What are the sales trends?" However, that does not specify any details.
Do you really mean the full set of data in the spreadsheet? Or did you mean something more specific, such as, "Analyze the monthly sales trends for our premium product line during Q4 2024, focusing on the year-over-year rate of growth in the Western region." When structuring your prompts, remember to include:
- Time periods you want to analyze
- Specific metrics that matter most
- Any particular segments or categories to focus on
- The type of comparison you're interested in (e.g., year-over-year, sequential growth)
The power of follow-up questions
One of Quadratic's most powerful features is its support for conversational analysis. Just as you might have a back-and-forth discussion with a data analyst, you can engage in a dialogue with the embedded AI to refine and deepen your understanding. For example, after receiving an initial summary of sales data, you might ask:
"What factors seem to be driving the growth in the Western region?"
"Can you break down these trends by customer segment?"
"How do these patterns compare to our historical seasonal variations?"
Each follow-up question builds upon the context of previous analyses, creating a progressively richer understanding of your data. It is also possible to click into the code cell that was initially generated by the AI. For example, you can modify the AI-generated code to adapt the table or visualization to get exactly what you need.
Extending analysis with code
For citizen developers and users comfortable with programming, Quadratic offers powerful ways to enhance your AI analysis through code integration. You might use:
- SQL to filter and aggregate data from a connected database before requesting AI insights
- Python to perform statistical analysis or create visualizations that complement AI-generated summaries
- JavaScript to build interactive elements that help communicate your findings
For example, you could use AI-generated Python to clean and preprocess your data, and then ask the AI to generate a chart, plotting the insights into a bar chart or histogram. This would create a powerful combination of programmatic precision and AI-driven insights.
Security and risk control
Perhaps the most critical concern in today's data-driven world is security. Traditional approaches to AI-powered analysis often require copying sensitive data into external platforms, creating significant security risks. Each time data leaves your secure environment, it becomes vulnerable to unauthorized access or accidental exposure.
Quadratic addresses this concern through a comprehensive security approach:
- Built-in SOC 2 and HIPAA compliance ensures your data meets rigorous security standards
- Optional self-hosting capabilities give organizations complete control over their data environment
- Integrated AI analysis eliminates the need to export sensitive information to external platforms
- For security, Quadratic has zero-day retention for user data.
By keeping your data within a secure, controlled environment while still enabling powerful AI analysis, Quadratic helps organizations maintain the delicate balance between accessibility and security.
This modern approach to data analysis should help prevent problems from occurring. By understanding these common pitfalls and how to address them, analysts can make informed decisions about their analytical tools and processes, ensuring both efficiency and security in their data operations.
Data security doesn't have to come at the expense of collaboration. You can share your AI-generated insights with colleagues in real-time, allowing them to see both the raw data and its analysis in context. This means everyone on your team can contribute to and benefit from the analysis while maintaining proper data governance.
The future of AI-powered data analysis
As we have explored throughout this post, the way spreadsheets are summarized and analyzed is undergoing a fundamental transformation. The days of manual data wrangling and copying between tools are giving way to integrated, AI-powered analysis that is both more efficient and more secure.
By bringing together the familiar interface of a spreadsheet with the power of large language models (LLMs) for data analysis, Quadratic removes the traditional barriers between data and insights. You no longer need to choose between the accessibility of a spreadsheet and the analytical power of AI. Now you can have both in one seamless environment.
The implications for your daily workflow are significant. Tasks that once consumed hours can now be completed in minutes. Analyses that previously required extensive manual preparation can now be performed with a few simple prompts. Most importantly, you can focus on understanding and acting on your insights rather than wrestling with tools and formatting.
As AI technology continues to evolve, Quadratic remains committed to staying at the forefront of data analysis innovation. From enhanced natural language processing to more sophisticated analytical capabilities, we are constantly working to make data analysis more intuitive and powerful for teams of all sizes.
Ready to transform your approach to data analysis? Sign up for Quadratic today and experience the power of integrated AI analysis for yourself.
Frequently Asked Questions (FAQ)
Q: Does it cost to use Quadratic AI Spreadsheet?
A: Being able to use an AI that can summarize a spreadsheet for free is the ‘tip of the iceberg.’ The embedded AI models include GPT-4o and Claude 3.5 Sonnet, among others. Their full capabilities are available to do analyses, and they include a wide variety of plots and graphs for visualizing results. Quadratic AI Spreadsheet is free for personal use,
Q: "How to summarize data in Excel with Quadratic?"
A: Simply import your Excel files directly into Quadratic, and no reformatting is required. The platform automatically preserves your data structure and formatting while adding structured data AI capabilities that are not embedded in Excel.
Q: "Can ChatGPT analyze a spreadsheet directly?"
A: While ChatGPT can analyze data, it requires copying and pasting when using the external (standalone) version. Quadratic integrates ChatGPT (GPT-4o) directly into your spreadsheet environment, eliminating the need for manual data transfer so you can analyse CSVs and other data files instantly.
Q: "Can ChatGPT summarize Excel data?"
A: Yes, but traditionally this requires copying data from Excel into ChatGPT. Quadratic streamlines this process by allowing the AI to analyze your data directly within the spreadsheet.
Q: "How does Quadratic compare to Google Sheets summarize data features?"
A: While Google Sheets offers basic summarization tools, Quadratic provides advanced AI-powered analysis capabilities that go beyond traditional spreadsheet functions. See the best alternative to Google Sheets.
Q: "Is Claude available in Quadratic for spreadsheet analysis?"
A: Quadratic supports multiple AI models, including Claude 3.7 Sonnet Thinking, allowing you to choose the best tool for your specific analysis needs.
Q: "Is it safe to use my business data in Quadratic?"
A: Yes, Quadratic maintains strict security standards with SOC 2 and HIPAA compliance. The optional self-hosting feature provides additional control over your data environment.
Additional resources
For a deeper understanding of Quadratic's capabilities:
- Explore our comprehensive documentation for detailed guides on LLM usage and advanced formulas
- Visit our YouTube channel for video tutorials on AI integration
- Join our community forum to share insights and best practices with other analysts
Technical support
For additional questions or support, our team is always available to help you make the most of Quadratic's capabilities. Contact us through our support portal or contact us directly through the platform's help features.