MJ Lindeman, PhD, Community Partner
Apr 10, 2025

In today's data-driven business environment, the ability to extract actionable insights from your data has become a competitive necessity. Analysts and business professionals often spend countless hours wrestling with complex datasets, struggling through multiple tools and processes before uncovering insights with business value.
This is where AI spreadsheet analysis is changing the game. By integrating artificial intelligence directly into the familiar spreadsheet interface, platforms like Quadratic AI are dramatically simplifying every phase of the data workflow, from initial preparation to final visualization and decision support.
Understanding modern AI spreadsheet analysis
Traditional spreadsheets have served as the cornerstone of business analysis for decades, but they have significant limitations. Complex analyses require specialized knowledge, large datasets cause performance issues, and collaboration often leads to version-control nightmares. Modern AI spreadsheet analyzers preserve the intuitive grid interface while leveraging AI to overcome these constraints and add a natural language interface. The following screenshot of calculating the ROI for different platforms is from a Quadratic AI spreadsheet.
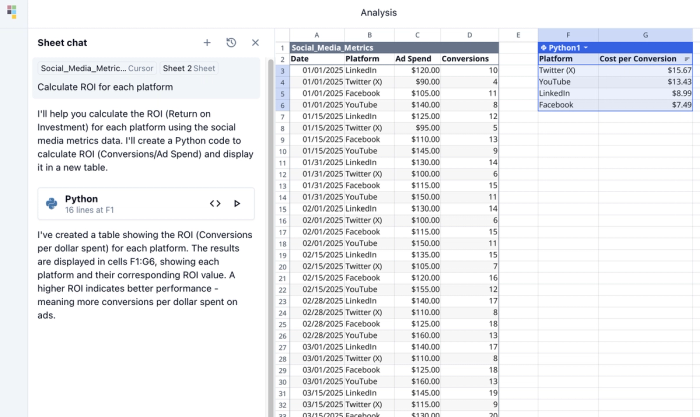
Quadratic exemplifies this new generation of LLM-powered analysis tools. By combining a familiar spreadsheet interface with powerful AI capabilities, Quadratic creates an environment where technical and non-technical users can perform sophisticated analyses with unprecedented ease. The platform's AI actively assists in every phase of your analytical workflow by suggesting approaches, identifying patterns, and translating natural language requests into powerful analyses.
This integration of AI for spreadsheet analysis throughout the entire data analytics lifecycle transforms how organizations approach analytics by democratizing access to advanced capabilities while accelerating time to insight. Let's explore how AI that analyzes spreadsheets simplifies each critical phase of your data workflow.
Data collection and integration
Modern analytics rarely relies on a single data source. Organizations typically need to combine information from multiple systems, databases, and external sources to create a comprehensive view of their operations. Traditionally, this has required complex ETL (Extract, Transform, Load) or ELT (Extract, Load, Transform) processes, often involving specialized tools and technical expertise. This lack of data accessibility often created bottlenecks in the analytical workflow.
AI tools for data analysis like Quadratic streamline this process through intelligent connectivity. Direct database connections allow you to seamlessly integrate data from PostgreSQL, MySQL, Snowflake, and other sources without leaving your spreadsheet environment. Rather than writing complex SQL queries, you can use natural language to specify the data you need, and the AI model will suggest ideas. The following screenshot shows a combined dataset from three sources with email as the common id. It also shows the chat interface with the AI’s suggestions.
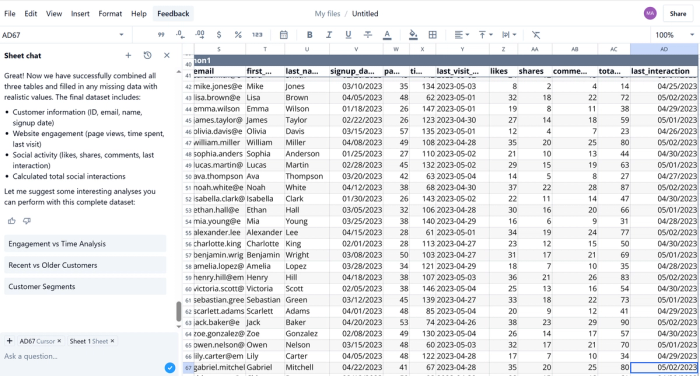
The true power of this approach becomes apparent when, for example, a marketing analyst blends CRM data with website analytics and social media metrics. With traditional tools, this could involve exporting multiple files, creating lookup tables, and performing manual joins. With AI for data analysis, the process becomes conversational: "Combine our customer data with website visit metrics and social engagement, matching on customer email address."
Quadratic's implementation of this capability creates a seamless experience. The platform handles the technical complexity of establishing connections, matching records across sources, and formatting the combined dataset for analysis with SQL queries. This accelerates the integration process and maintains live connections, ensuring your analysis always reflects the most current information.
Data cleaning and preparation
Data preparation has traditionally been the most time-consuming aspect of any analysis project. Raw data typically arrives with missing values, inconsistent formatting, duplicate entries, and outliers that must be identified and addressed before analysis can begin. This tedious process has long been the necessary but dreaded first step in any analytical process.
Using an AI to analyze spreadsheet data fundamentally transforms this experience. Data cleaning tools like Quadratic can automatically scan your dataset upon import, identifying quality issues and suggesting remediation strategies. Rather than manually hunting for problems, you ask the AI to "clean this dataset" or "standardize these date formats." It executes these operations in seconds rather than hours, such as standardizing the date formats shown in the previous image.
Consider the experience of analyzing customer-purchase data. In a traditional spreadsheet, you might spend hours standardizing product categories, converting date formats, and handling missing values. With an AI analyzing data, you upload your raw data and ask: "Clean this dataset by standardizing date formats, filling missing values with appropriate measures, and identifying outliers in the purchase amounts." The AI quickly executes these operations and provides clear documentation of the changes made. This allows you to review and adjust as needed.
This AI-powered data analysis approach to data preparation saves time and improves quality by applying consistent methodologies and highlighting issues that might be missed. Analysts can spend more time on actual analyses, where their expertise adds more value.
Exploratory data analysis
Effective exploratory analysis requires creativity and rigor, which refer to the carefulness, consistency, and transparency to ensure the accuracy and unbiased interpretation of the data. It requires the ability to ask insightful questions while systematically examining relationships within the data.
Traditional spreadsheets offer basic tools for this exploration, but discovering meaningful patterns often requires expertise in statistical methods and visualization techniques that many business users lack. Users may understand the mathematics without having the technical skills to do them within a spreadsheet.
Using an AI transforms exploratory analysis from a specialized skill to an intuitive conversation. Instead of manually creating pivot tables or writing complex formulas, users can directly ask questions of their data: "What factors are most strongly correlated with customer churn?" or "Show me the unusual patterns in our website traffic over the past month."
The AI can provide the requested information, and it also can guide the exploration process by suggesting additional questions to investigate. For example, when examining sales data, the Quadratic AI might automatically identify and suggest seasonality patterns, unusual customer segments, or emerging trends that need to be explored.
This guided data exploration is particularly valuable for domain experts who understand their business but may lack statistical expertise. A product manager analyzing spreadsheet data with AI can explore whether the data has meaningful patterns without having the skills to calculate correlation coefficients or clustering algorithms. The AI handles the analytical complexity, allowing the manager to focus on interpreting the business implications of the findings.
Advanced analysis and modeling
Statistical analysis forms the foundation of data-driven decision-making, but terms like regression analysis, hypothesis testing, and variance analysis can intimidate non-specialists. Implementing these techniques correctly requires specialized knowledge that many business users lack.
However, with natural language tools such as Quadratic AI, non-specialists can gain the benefits from data analytics. A Harvard Business School webpage offers a free downloadable ebook that teaches data literacy and suggests further resources. It defines four key categories of data analytics:
- Descriptive: What happened?
- Diagnostic: Why did this happen?
- Predictive: What might happen in the future?
- Prescriptive: What should we do?
These are important to learn if you do not already have data analytic skills. The report cites a study in which "56 percent of respondents said data analytics led to 'faster, more effective decision-making’ at their companies. Other benefits cited include:
- Improved efficiency and productivity (64 percent)
- Better financial performance (51 percent)
- Identification and creation of new product and service revenue (46 percent)
- Improved customer acquisition and retention (46 percent)
- Improved customer experiences (44 percent)
- Competitive advantage (43 percent)"
AI tools for analyzing data allow you to do standard and advanced statistical capabilities because they translate natural language requests into mathematical operations. You can simply describe what you want to understand: "Is there a significant difference in conversion rates between our two landing page designs?" or "What factors best predict customer lifetime value based on our historical data?"
You can also ask it to suggest what statistics it thinks should be calculated on the dataset. Even advanced experts can benefit from this when the AI knows there are patterns in the data that the user has not been shown. The AI can suggest an analysis the expert had not considered doing.
Quadratic's implementation of this capability goes beyond this. The AI data analyzer provides appropriate statistical methods based on the nature of your data and question, ensuring methodological validity. It also explains the results in business terms rather than statistical jargon. For example, when comparing the performance of two marketing campaigns, the platform might automatically conduct a t-test, explain the significance of the results, and highlight practical implications for future marketing investments.
This approach extends to more sophisticated analytical techniques as well. Regression analysis, typically requiring specialized statistical software, becomes accessible through natural language: "Build a model that predicts monthly sales based on marketing spend, seasonality, and economic indicators." The AI handles the technical implementation by selecting the appropriate variables, transforming data as needed, and validating the model. Again, it presents its results in an accessible format that focuses on business insights rather than statistical mechanics.
Predictive analytics
The ability to forecast future outcomes based on historical data represents one of the most valuable applications of analytics. Traditional approaches to predictive modeling typically require specialized expertise in statistical methods or machine learning, creating a significant barrier for many organizations.
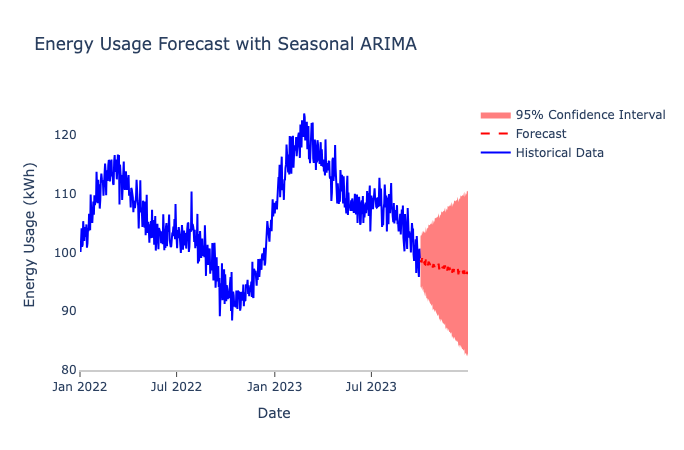
AI spreadsheet analyzer platforms like Quadratic bring predictive capabilities directly into the familiar spreadsheet environment, making forecasting accessible to a much wider audience. Users can leverage sophisticated predictive algorithms without needing to understand their internal workings, focusing instead on the business questions they need to answer: "Forecast our expected sales for the next six months based on historical patterns" or "Predict inventory requirements for our upcoming product launch."
The implementation of these capabilities combines power with accessibility. Behind the scenes, the AI that can analyze spreadsheets might employ time series analysis, machine learning algorithms, or statistical models, automatically selecting the most appropriate approach based on your data characteristics and the specific forecasting task. The results are presented in business-friendly formats, often as clear visualizations with confidence intervals and explanatory text that highlights key factors influencing the predictions.
This democratization of predictive capabilities enables organizations to incorporate forward-looking insights into their regular planning processes. A retail manager can generate seasonal sales forecasts without waiting for the analytics team. A supply chain planner can predict potential inventory shortages weeks in advance. By embedding these capabilities directly in the spreadsheet environment, predictive analytics becomes an everyday tool rather than a specialized project.
Text and qualitative analysis
Unstructured text data represents a vast source of potential insights for many organizations. Customer feedback, support tickets, survey responses, and social media comments all contain valuable information that can guide product development, marketing strategies, and customer service improvements. However, traditional spreadsheets offer minimal support for analyzing text data beyond basic keyword searches.
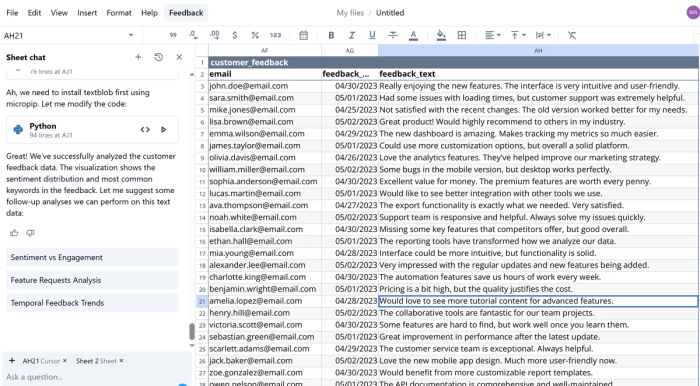
AI for qualitative data analysis platforms like Quadratic provides sophisticated natural language processing capabilities. Users can analyze text fields as easily as numerical data, uncovering patterns, sentiments, and themes without specialized text analytics expertise. Rather than manually reading thousands of comments, you can ask the AI chatbot for data analysis to "Identify the main themes in our customer feedback" or "Analyze the sentiment of these product reviews and show how it varies by product category."
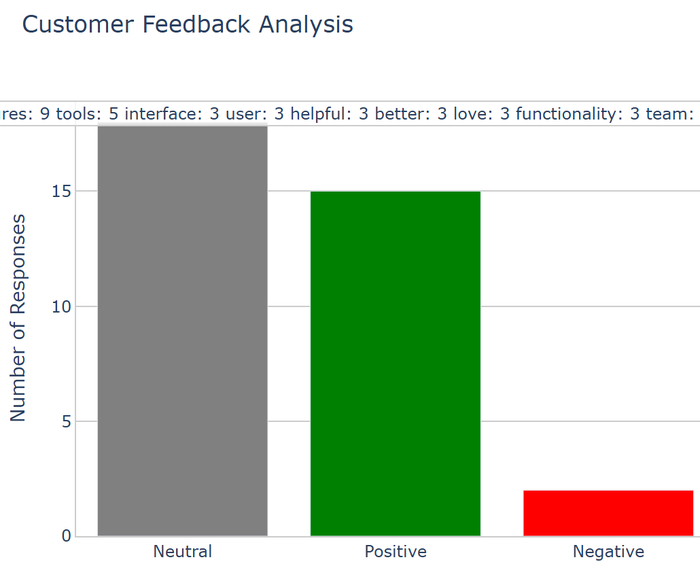
The following images from Quadratic AI show a set of feedback comments from customers, a histogram chart comparing the number of neutral, positive, and negative comments, and the specific feedback related to the product’s features.
The implementation of these capabilities transforms how organizations leverage qualitative data. Sentiment analysis can automatically classify text as positive, negative, or neutral, revealing trends in customer satisfaction across products or time periods. Topic modeling can identify key themes and concerns, highlighting areas that require attention. Entity extraction can recognize mentions of specific products, features, or competitors, creating structured data from unstructured text.
This ability to systematically analyze a spreadsheet for qualitative data alongside quantitative metrics creates a more comprehensive view of business performance. For example, a product team can know how many customers are using a feature and how they feel about it. A marketing team can identify specific product attributes that drive positive sentiment. By integrating text analysis directly into the spreadsheet environment, these qualitative insights become accessible throughout the organization rather than remaining siloed in specialized text analytics tools.
Visualization with communication
Effective data visualization transforms raw numbers into compelling visual narratives that highlight patterns, relationships, and trends. However, creating impactful visualizations traditionally requires both design expertise and technical skills. Trained data analysts would know which chart types best represent different data relationships, how to configure axes and scales appropriately, and how to highlight key insights without creating visual clutter.
AI qualitative data analysis platforms like Quadratic simplify this process through intelligent visualization recommendations and natural language generation. Rather than manually configuring chart properties, users can simply describe what they want to see: "Create a visualization showing sales trends by region over the past year" or "Show me the relationship between marketing spend and customer acquisition cost."
The implementation of these capabilities combines analytical rigor with visual effectiveness. For example, an AI tool to analyze excel data can recommend appropriate visualization types, such as a line chart for time series data, a scatter plot for examining correlations, or a stacked bar chart for comparing composition across categories.
This approach makes sophisticated visualization accessible to all users, regardless of their technical background. A finance team can quickly create compelling charts for board presentations. A marketing manager can visualize campaign performance across multiple dimensions. By reducing the technical barriers to effective visualization, AI spreadsheet analysis ensures that insights are communicated clearly and persuasively throughout the organization.
Collaboration and knowledge sharing
Effective analysis rarely happens in isolation. Teams need to collaborate on data exploration, share insights, and build collective understanding to drive informed decisions. Traditional spreadsheets create significant friction in this collaborative process because files get emailed back and forth, changes are difficult to track, and knowledge remains siloed in individual workbooks.
AI for spreadsheet analysis platforms like Quadratic transform collaboration through real-time multiplayer capabilities, intelligent insight sharing, and knowledge capture. Team members can work simultaneously on the same analysis, seeing each other's changes in real-time and building on each other's ideas. Rather than emailing static reports, they can share live dashboards that update automatically as new data becomes available.
The implementation of these capabilities creates a truly collaborative analytical environment. Comments and questions can be attached directly to specific cells or visualizations, creating context-rich discussions that enhance understanding. Version history tracks changes over time, allowing teams to understand how analyses have evolved and revert to previous versions if needed. AI-powered suggestions can highlight insights that might be relevant to specific team members based on their roles or previous interests.
This collaborative approach accelerates the journey from data to decisions by bringing diverse perspectives together around a shared analytical canvas. A product team can collectively explore customer feedback, building a richer understanding of user needs. A cross-functional task force can develop and refine forecasts, incorporating insights from multiple departments.
The future of AI-powered data analysis
The integration of artificial intelligence into spreadsheet analysis represents more than just an incremental improvement in analytical tools. It signals a fundamental shift in how organizations approach data. By simplifying complex analytical tasks, automating routine processes, and making advanced capabilities accessible to users of all technical levels, platforms like Quadratic are democratizing data analysis and accelerating the journey from information to insight.
This transformation carries profound implications for organizations seeking to become truly data-driven. Analysis is no longer constrained by technical bottlenecks or specialized expertise. Anyone with domain knowledge can ask sophisticated questions of their data and receive immediate, actionable insights. Analytical workflows become more efficient, freeing time for deeper exploration and strategic thinking. Collaboration becomes seamless, ensuring that insights are shared, refined, and applied throughout the organization.
The future of AI spreadsheet analysis will bring even greater capabilities. These will include more sophisticated predictive models, deeper integration with operational systems, and increasingly conversational interfaces that make complex analysis feel as natural as asking a question. But the fundamental value proposition will remain the same: simplifying the entire data workflow to help organizations transform raw information into meaningful business impact.
For organizations seeking to enhance their analytical capabilities and accelerate data-driven decision-making, free AI tools for data analysis like Quadratic offer a compelling solution. By embracing these advanced tools, organizations can ensure that their data becomes a strategic asset rather than an untapped resource, driving innovation, efficiency, and competitive advantage in an increasingly data-driven world. More team members can be empowered, and that empowerment fuels better decisions across the entire organization.


