MJ Lindeman, PhD, Community Partner
Mar 19, 2025

When your competitors are not analyzing their data, being able to transform raw information into actionable insights gives you a crucial competitive advantage. Organizations across industries increasingly rely on data analytics to inform decision-making, optimize operations, identify opportunities, and solve complex problems. However, effective analytics is far more than running numbers through algorithms. The data analytics lifecycle is a structured process with distinct phases that build upon each other to deliver meaningful results.
From an IBM report, “Business analytics (BA) is then a subset of BI, with business analytics providing the prescriptive, forward-looking analysis.” The core outputs are actionable insights, which are statements of new knowledge that, when implemented, produce business value. The linked report discusses how to derive insights from data by identifying the six attributes of actionable insights: alignment, context, relevance, specificity, novelty, and clarity.
The data analytics lifecycle is a framework of seven phases going from initial data collection to the final presentation of insights. This post describes each phase and its challenges. It also describes the best practices to maximize value in your end-to-end analytics process. AI is rapidly changing the available tools, and Gartner predicts that by 2027, “AI assistants and AI-enhanced workflows incorporated into data integration tools will reduce manual intervention by 60% and enable self-service data management.”
Understanding the data analytics life cycle
The data analysis life cycle represents the end-to-end process of working with data to extract actionable insights. Different organizations may use slightly different terminology or combine certain phases in an end-to-end data project. The core components of the life cycle of data analysis typically include:
- Problem Definition and Data Requirements
- Data Collection and Access
- Data Cleaning and Preparation
- Exploratory Data Analysis
- Advanced Analysis and Modeling
- Visualization with Communication
- Implementation and Monitoring
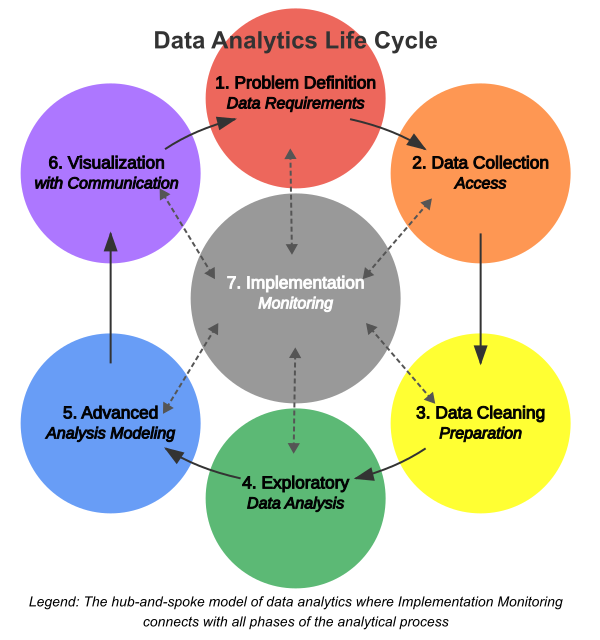
This data analytics life cycle diagram illustrates how each phase in the data management lifecycle builds upon the previous one, In practice, however, the process is often iterative rather than strictly linear. The data analysis life cycle diagram below shows the cyclical nature of this process because insights often lead to new questions. The life cycle needs to be carefully analyzed when introducing any type of AI into any of the seven phases.
In this visualization, the outer circles represent the six primary phases of the data analytics lifecycle arranged in a clockwise sequence. Although the life cycle is drawn as an iterative linear process, any phase can feed back into a previous phase and cause change. The double-headed dashed arrows connect each outer phase to the central "Implementation & Monitoring" hub (Phase 7), illustrating that (a) each phase can directly inform or be affected by implementation decisions, and (b) implementation results can trigger work or rework in any of the other phases.
This hub-and-spoke model more accurately represents how data analytics works in practice.
- Insights from any phase might necessitate immediate implementation.
- Implementation and monitoring often reveal needs that require jumping directly to specific phases.
- The process is highly iterative rather than strictly sequential.
The central positioning of Implementation and Monitoring emphasizes its role as both a destination for insights and an origin point for new questions and analytical needs. This creates a dynamic ecosystem where data-driven decisions and their outcomes continuously inform each other.
While this specific presentation is original, the general framework of the data analytics lifecycle is established industry knowledge. This visualization better captures the reality of modern data analytics workflows, where teams frequently move between phases based on findings, business needs, and implementation results, and where AI may be introduced into any or all of the life-cycle phases.
The seven phases of the life cycle
Let's explore each of the data analysis life cycle phases in detail.
Phase 1: Problem definition and data requirements
Every effective analytics project begins with a clear definition of the business problem or opportunity. This critical first step in the analysis lifecycle ensures that subsequent analysis will deliver relevant, valuable insights rather than merely interesting but ultimately unusable information.
Strong problem definitions are:
- Specific and focused on a particular challenge or opportunity
- Aligned with broader organizational goals and strategies
- Measurable, with clear criteria for success
- Actionable, leading to potential decisions or intervention
For example, rather than a vague goal like "understand customer behavior," a well-defined problem might be "identify factors contributing to customer churn in our premium subscription tier to develop targeted retention strategies."
Once the business question is clear, the next step in this phase involves identifying what data is needed. This includes:
- Types of data required (demographic, transactional, behavioral, etc.)
- Level of granularity needed (individual, aggregate, etc.)
- Time period of interest (historical depth, frequency of updates)
- Internal and external data sources to be consulted
This phase also involves a preliminary assessment of data availability and accessibility. Are the necessary datasets already available within the organization? Will external data need to be acquired? Are there legal or compliance considerations that could limit data usage?
By investing time upfront in a clear problem definition and requirements, organizations can avoid the common pitfall of collecting massive amounts of data without a clear purpose. Having no clear purpose often leads to "analysis paralysis" or insights that do not address key business needs.
Phase 2: Data collection and access
With requirements defined, the next phase focuses on identifying and accessing data sources. The access mechanism(s) must be established for each source. Common data sources include:
- Internal operational systems (CRM, ERP, marketing automation)
- Data warehouses and data lakes
- External datasets (market research, public datasets, third-party providers)
- Web and social media platforms
- IoT devices and sensors
- Survey and research data
Accessing this data often requires collaboration with IT teams, data engineers, or external providers. Technical considerations include:
- Database connections and query methods
- API access and integration
- File formats and transfer mechanisms
- Authentication and authorization protocols
- Data governance and compliance requirements
Notice that Storage is not listed in the seven phases or on the diagram because data may be transformed either before or after it is loaded into the storage destination. This is often discussed as choosing between an ETL (Extract, Transform, Load) process and an ELT (Extract, Load, Transform) process. For either, loading data into its storage destination may involve:
- Batch processing of historical data
- Setting up streaming pipelines for real-time data
- Creating appropriate storage structures (databases, data lakes, etc.)
- Establishing data catalogs to track available datasets
- Implementing metadata management to document data characteristics
The collection phase often reveals gaps between ideal data requirements and what is actually available. This may necessitate adjusting expectations, finding proxy measures, or initiating new data collection efforts to address critical gaps.
Phase 3: Data cleaning and preparation
Data rarely arrives in an analysis-ready state, and the importance of data cleaning is often undervalued. Raw data typically contains errors, inconsistencies, and structural issues that must be addressed before meaningful analysis can begin. This data cleaning phase is often the most time-consuming part of the data analytics life cycle, with practitioners reporting that it can consume large blocks of their total project time.
Common data quality issues include:
- Missing values: Gaps in the data that must be addressed through deletion, imputation, or flagging
- Duplicate records: Redundant entries that can skew analyses and waste computational resources
- Inconsistent formatting: Variations in how dates, currencies, or categorical values are represented
- Outliers and errors: Values that fall outside expected ranges or contain obvious mistakes
- Structural problems: Issues with how data is organized that complicate analysis
Despite being labor-intensive, thorough data cleaning is essential for reliable results. As the saying goes: "garbage in, garbage out." Even the most sophisticated analytical techniques cannot compensate for poor-quality input data.
Beyond cleaning, raw data typically requires transformation to create analysis-ready datasets. This may involve:
- Standardizing formats and units across different data sources
- Normalizing or scaling numerical variables
- Encoding categorical variables for mathematical analysis
- Creating derived variables that better capture phenomena of interest
- Aggregating or summarizing data tables to appropriate levels
- Restructuring data between wide and long formats
Many analytical projects require combining multiple data sources to create a comprehensive view. This integration process may involve:
- Identifying common keys or matching criteria across datasets
- Resolving entity resolution challenges (e.g., determining when records from different systems represent the same customer)
- Handling conflicting information from different sources
- Establishing temporal alignment between datasets collected at different times
External data enrichment may also add valuable context to internal datasets. For example, augmenting customer data with demographic information, or adding geographic data to retail locations.
Phase 4: Exploratory data analysis (EDA)
Once data is cleaned and prepared, exploratory data analysis (EDA) provides the first opportunity to understand what the data reveals. This critical phase helps analysts:
- Understand the distribution and characteristics of key variables
- Identify relationships and correlations between variables
- Discover patterns, trends, and anomalies
- Generate initial hypotheses for deeper investigation
- Validate assumptions about the data
EDA combines visual and statistical techniques to develop a comprehensive understanding of the dataset. Simple summary statistics such as means, medians, and standard deviations provide a starting point, while data visualizations reveal patterns that numbers alone might miss. Effective exploratory analysis typically employs multiple techniques:
- Univariate analysis examines individual variables through histograms, box plots, and summary statistics.
- Bivariate analysis explores relationships between pairs of variables through scatter plots, correlation coefficients, and contingency tables.
- Multivariate analysis investigates interactions among multiple variables simultaneously.
- Temporal analysis identifies trends, seasonality, and patterns over time.
- Geographic analysis reveals spatial patterns and relationships.
Throughout the EDA phase, the goal is not just to understand what the data contains, but to develop insights relevant to the original business question. Strong EDA maintains the connection between technical exploration and business context.
Phase 5: Advanced analysis and modeling
The advanced analysis and modeling phase includes selecting the appropriate analytical techniques, developing and validating (or choosing) the model, and then interpreting and evaluating the model’s results in the context of the original question to be answered or the problem to be solved.
Based on the business question and insights from exploratory analysis, analysts select appropriate advanced analytical techniques. These broadly fall into several categories:
- Descriptive analytics summarizes what has happened through aggregations, segmentation, and summarization.
- Diagnostic analytics examines why something happened through correlation analysis, factor analysis, and root cause investigation.
- Predictive analytics forecasts what might happen through regression, classification, time series, and machine learning approaches.
- Prescriptive analytics recommends actions through optimization, simulation, and decision analysis.
The choice of specific techniques depends on:
- The nature of the business question
- Characteristics of the available data
- Required level of statistical confidence
- Available analytical tools and expertise
- Interpretability requirements for stakeholders
For predictive and prescriptive approaches, model development follows a structured process:
- Feature selection: Identifying the most relevant variables for inclusion
- Algorithm selection: Choosing appropriate modeling techniques
- Model training: Using a portion of data to develop initial models
- Hyperparameter tuning: Optimizing model parameters for performance
- Validation: Testing models on held-out data to assess generalizability
- Ensemble methods: Combining multiple models for improved performance
Model validation is particularly important to ensure that results will generalize beyond the specific dataset used for training. Cross-validation techniques, testing on independent datasets, and monitoring for model drift over time help ensure reliable results.
When a model is developed, its results must be interpreted in the context of the original business question. This involves:
- Assessing statistical significance and confidence levels
- Evaluating practical significance and business impact
- Understanding model limitations and constraints
- Identifying potential biases or ethical considerations
- Considering alternative explanations for observed patterns
The goal is to produce accurate models that extract meaningful insights that inform decision-making. Technical performance metrics (accuracy, precision, recall) matter, but business relevance remains the ultimate criterion for success.
Phase 6: Visualization with communication
Effective communication of analytical results requires translating complex findings into formats that stakeholders can easily understand and act upon, typically referred to as last-mile analytics. Data visualization plays a crucial role in this translation, and the choice of type of visualization depends heavily on the nature of the data and the key message.
Beyond individual visualizations, effective communication often requires building a coherent data story that:
- Establishes relevant context for the analysis
- Guides audiences logically through key findings
- Connects analytical results to business implications
- Addresses potential questions or objections
- Leads naturally to recommended actions
Interactive dashboards increasingly complement static reports, allowing stakeholders to explore data dynamically and focus on aspects most relevant to their specific needs with self-serve analytics. These tools provide multiple levels of detail, from high-level summaries to granular exploration. Different stakeholders have different needs and technical backgrounds. Consequently, effective communicators adjust their language, level of detail, and visualization complexity based on audience needs, ensuring that insights are not just presented but understood and applied.
Phase 7: Implementation and monitoring
The implementation phase often requires connecting analytical teams with operational units that will apply the insights in practice. The ultimate value of analytics comes from the actions they enable that produce valuable results. Implementing analytical results involves:
- Translating insights into specific action plans
- Integrating findings into business processes and decision-making
- Developing implementation timelines and responsibility assignments
- Creating procedures to track the impact of data-driven changes
- Establishing feedback mechanisms to refine approaches based on results
Implementing an actionable insight is rarely a one-time event. When insights have been implemented, ongoing monitoring helps:
- Track the impact of changes made based on analytical findings
- Identify when models or insights need to be updated due to changing conditions
- Discover new questions that emerge from initial results
- Refine methodologies based on observed outcomes
This monitoring creates a feedback loop, potentially initiating new iterations of the data analysis life cycle. Changes will cause business questions to evolve and new data to become available.
Organizations typically encounter several challenges when implementing the data analytics life cycle:
- Data silos and accessibility issues: Critical data may be scattered across systems or departments with limited integration.
- Data quality and governance concerns: Inconsistent standards for data collection and management can undermine analytical efforts.
- Skill gaps and resource constraints: Organizations may lack the specialized skills needed for advanced analytics.
- Change management hurdles: Transitioning to data-driven decision-making often requires cultural and process changes.
- Balancing speed and rigor: Pressure for quick insights must be balanced with methodological thoroughness.
Incorporating several best practices into the various data analysis life cycle phases can decrease or eliminate some of the challenges:
- Maintain business alignment: Keep the original business question at the center of all analytical activities.
- Embrace iteration: Recognize that analytics is rarely linear, with insights at one stage often requiring revisiting earlier phases.
- Document extensively: Record assumptions, methodologies, and decisions throughout the process for transparency and reproducibility.
- Foster collaboration: Build cross-functional teams that combine domain expertise with technical skills.
- Invest in infrastructure: Develop a solid data infrastructure and analytics strategy that enables efficient data access, processing, and sharing.
- Focus on adoption: Actively work to ensure insights are understood, trusted, and utilized by decision-makers.
- Prioritize ethical considerations: Address privacy, fairness, and potential biases throughout the analytics process.
The introduction of AI tools for data analysis can also decrease some of the challenges. For example, using LLMs for data analysis with Quadratic eliminates much of the hassle in data cleaning and preparation. It currently integrates natively with 4 databases and data warehouses as well as APIs for real-time updates, and integrated connections can be requested for other sources.
AI capabilities augment human analysts rather than replace them. The analysts can then focus on higher-value activities requiring judgment and domain expertise. Also, analytics capabilities are expanding to non-specialists because AI for business intelligence provides a natural language interface. For example, Quadratic AI’s natural language interface allows non-technical stakeholders to engage directly with data.
Conclusion: From data to insight to action to value
The data analytics life cycle provides a structured framework for transforming raw data into valuable insights and actions. Processes in the phases from problem definition through data collection, preparation, analysis, and communication to implementation can be made more effective and avoid common pitfalls.
However, successful data lifecycle management requires a thoughtful combination of business context, technical expertise, and communication skills. The most successful business analytics from data to insights initiatives recognize that the lifecycle is not just a technical process but a socio-technical one, requiring alignment between people, processes, and technology.
The data analysis process and data life cycle described in this article provide a comprehensive framework for data analytics end-to-end project planning and execution. In a world where data volumes continue to grow exponentially, making the analytics life cycle more efficient and effective represents a crucial advantage that separates data-driven leaders from their competitors.