
Tyler Von Harz, Community Partner
Mar 13, 2025

Organizations today generate massive amounts of data, but raw numbers alone don’t drive decision-making.
Traditional data analysis methods can be slow and cumbersome, requiring extensive cleaning, preparation, and manual exploration before insights emerge. Missing values, outliers, and inconsistencies create further roadblocks, delaying business-critical decisions. Without the right approach, the process can be frustrating, inefficient, and prone to errors.
Data exploration is the structured process of analyzing datasets to uncover patterns, detect anomalies, and identify relationships between variables. In this guide, we’ll break down the data exploration process, discuss best practices and challenges, and highlight tools that can help you work smarter with your data.
What is data exploration?
Data exploration serves as a foundational part of gathering business intelligence. It involves examining datasets to uncover their main characteristics, often employing visual and statistical techniques.
Data exploration is the initial phase in data analysis where analysts employ statistical tools and visualization methods to understand the dataset's structure, content, and interrelationships. The process aids in identifying patterns, spotting anomalies, and testing assumptions, as a result, setting the stage for more in-depth analysis.
Recognizing recurring themes or behaviors within the data helps in understanding underlying processes and can inform predictive models. For instance, visual tools like histograms or scatter plots can reveal distributions and relationships between variables. The Institute of Data emphasizes that one of the critical objectives of exploring data is to "identify patterns or relationships within the dataset."
Analyzing how data is spread and how variables interact provides a foundation for selecting appropriate analytical methods and building accurate models. Analytics Vidhya describes data exploration as a process where analysts "examine large datasets to uncover patterns, outliers, and relationships before formal modeling and analysis occur." Let’s take a detailed look at the process to see how exactly they do this.
The data exploration process
Embarking on a data science exploration project necessitates a comprehensive understanding of the dataset at hand. The data exploration process is a critical phase that involves several key steps: initial data analysis, data cleaning and preparation, and exploratory data analysis (EDA). Each step ensures that the data is accurate, consistent, and ready for insightful analysis.
1. Initial data analysis
The first step in the data exploration process after accessing the data is assessing the quality and completeness of the data. This involves evaluating the dataset for missing values, inconsistencies, and potential errors.
Summarizing data tables using descriptive statistics means analysts can gain insights into central tendencies, dispersion, and overall data distribution. Having this foundational understanding is extremely important for guiding subsequent analysis and decision-making.
2. Data cleansing and preparation
Once the initial assessment is complete, the focus shifts to data cleaning and preparation. This step addresses issues identified during the initial analysis: Handling missing data — something which would otherwise lead to biased or inaccurate results. Strategies such as imputation, where missing values are estimated based on other available data, or omission, where incomplete records are excluded, are commonly employed.
For consistency and comparability, data also usually needs to be transformed or normalized. This could involve converting data into standardized formats, scaling numerical values, or encoding categorical variables. Such transformations facilitate more effective analysis and modeling.
Effective data cleaning and preparation are vital, as they directly impact the quality of insights derived from the data. As said best by DataCamp, "Data cleaning is a very basic building block of data science."
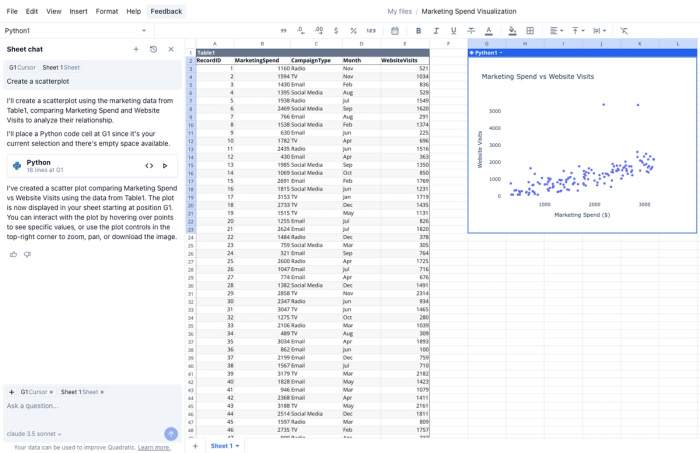
Tools like Quadratic have made data cleaning easy with the combination of native AI and built-in support for Python, allowing users to simply ask for what they need in natural language.
3. Exploratory data analysis
With clean and prepared data, analysts proceed to Exploratory data analysis (EDA). EDA serves as a critical step in the data exploration process, enabling analysts to make informed decisions and guiding the direction of more advanced modeling efforts. IBM emphasizes that EDA helps "determine how best to manipulate data sources to get the answers you need."
EDA employs statistical and visualization techniques to uncover underlying structures, patterns, and relationships within the data. Analysts apply methods such as correlation analysis, regression analysis, and hypothesis testing to identify significant relationships and trends. Insights gained during EDA guide the development of hypotheses that can be tested in further analyses or experiments.
Key techniques and tools for data exploration
Established players like Tableau and Microsoft Power BI have incorporated AI features to enhance their offerings. Tableau utilizes machine learning algorithms to automate data visualization, enabling users to identify patterns and trends effortlessly. Microsoft Power BI integrates with the broader Microsoft ecosystem, offering AI-driven analytics and real-time data monitoring, which facilitates proactive business decisions.
Quadratic takes this a step further with native AI and the ability to do data exploration with Python end-to-end naturally in your spreadsheet.
Data visualization
Visual representation is a cornerstone of data exploration and visualization that lets you discern patterns, trends, and anomalies that may not be apparent in raw data. Common chart types include:
- Histograms – Depict the distribution of a single variable, showing the frequency of data points within specified ranges.
- Scatter plots – Illustrate relationships between two continuous variables, aiding in identifying correlations or deviations.
- Box plots – Summarize data distributions, highlighting the median, quartiles, and potential outliers.
Then there are statistical methods. Beyond visualization, statistical techniques are essential in uncovering underlying structures within data. Key methods include:
Correlation analysis is another data analytics technique that measures the strength and direction of the relationship between two variables, indicating how one may predict the other. Regression analysis is another method that assesses the relationship between dependent and independent variables, enabling predictions and identifying influential factors.
Software and platforms
The selection of the best data exploration tools is arguably the most important component of efficient analysis. Several AI tools for data analysis stand out for their capabilities:
There’s Tableau, a leading data visualization tool that lets you create interactive and shareable dashboards. Its drag-and-drop interface makes it accessible for users to craft complex visualizations without extensive coding knowledge.
Developed by Microsoft, Power BI enables users to connect to various data sources, create detailed reports, and share insights across organizations. Its integration with other Microsoft services enhances its versatility.
Another Microsoft tool commonly used is Excel. A ubiquitous tool in data analysis, Excel offers functionalities for data manipulation, statistical analysis, and visualization. Recent enhancements, such as the integration of Python, have expanded its analytical capabilities, allowing for advanced data exploration and preparation.
One of the most powerful tools to hit the market recently is Quadratic, an AI-powered spreadsheet platform that combines traditional spreadsheet functionalities with advanced data science features. Quadratic lets you work with multiple languages — Python, SQL, and JavaScript — enabling a quick and easy integration of code and data. Plus, its native AI-driven analytics facilitate efficient data processing and visualization, positioning it among the best data exploration tools available.
Best practices and challenges in data exploration
Effective data exploration is a cornerstone of successful data analysis and exploration, enabling analysts to uncover patterns, identify anomalies, and derive actionable insights. However, this process is fraught with challenges that require strategic approaches and the right tools to overcome.
Iterative approach to data exploration and analysis
Adopting an iterative methodology allows analysts to refine their understanding of the data progressively. Taking this approach involves repeatedly revisiting and reassessing data, hypotheses, and analytical methods to enhance accuracy and depth of insights. Such a cyclical process ensures that findings are continually validated and improved upon.
Dealing with incomplete or biased data
Incomplete datasets can lead to skewed analyses and unreliable conclusions. Similarly, biased data can perpetuate inaccuracies and systemic errors. Addressing these issues requires meticulous data cleaning and validation processes to ensure the integrity of the analysis. As highlighted by Oracle, data quality is paramount, and challenges such as inaccuracy, incompleteness, and data staleness must be addressed to avoid incorrect insights.
Ensuring data privacy and security during exploration
The exploration of sensitive data necessitates stringent privacy and security measures. Analysts must navigate regulatory requirements and implement robust protocols to protect data from unauthorized access and breaches. This is particularly critical in sectors handling personal or confidential information.
Leveraging advanced data exploration software like Quadratic
The selection of appropriate tools is vital for effective data exploration. Data exploration platforms that offer integration of various data analysis and exploration functionalities can significantly enhance your productivity. For instance, Quadratic is an AI-powered spreadsheet platform that combines traditional spreadsheet capabilities with advanced data science features. You can pose questions or commands in plain English, and the platform interprets and executes these queries, streamlining the data exploration and visualization process.
Connecting with your database is a huge requirement for efficient data exploration. Quadratic enables direct connections to several types of databases, including PostgreSQL, MySQL, and Snowflake. This capability allows you to query and analyze live data without cumbersome import/export procedures. The platform's AI can also assist in generating SQL queries, simplifying the process for users unfamiliar with query languages.
Conclusion
Data exploration is the foundation of any successful data analysis and exploration process. From understanding raw datasets to visualizing trends and uncovering hidden relationships, applying the right data exploration techniques, tools, and methodologies ensures that analysts can make informed decisions with confidence.
Even with challenges like incomplete data, biases, and security concerns, leveraging advanced data exploration and visualization tools can significantly streamline your workflows and improve accuracy.
If you’re serious about turning raw data into real intelligence, it’s time to upgrade your toolkit. Explore how Quadratic can change the way you explore, analyze, and visualize your data.