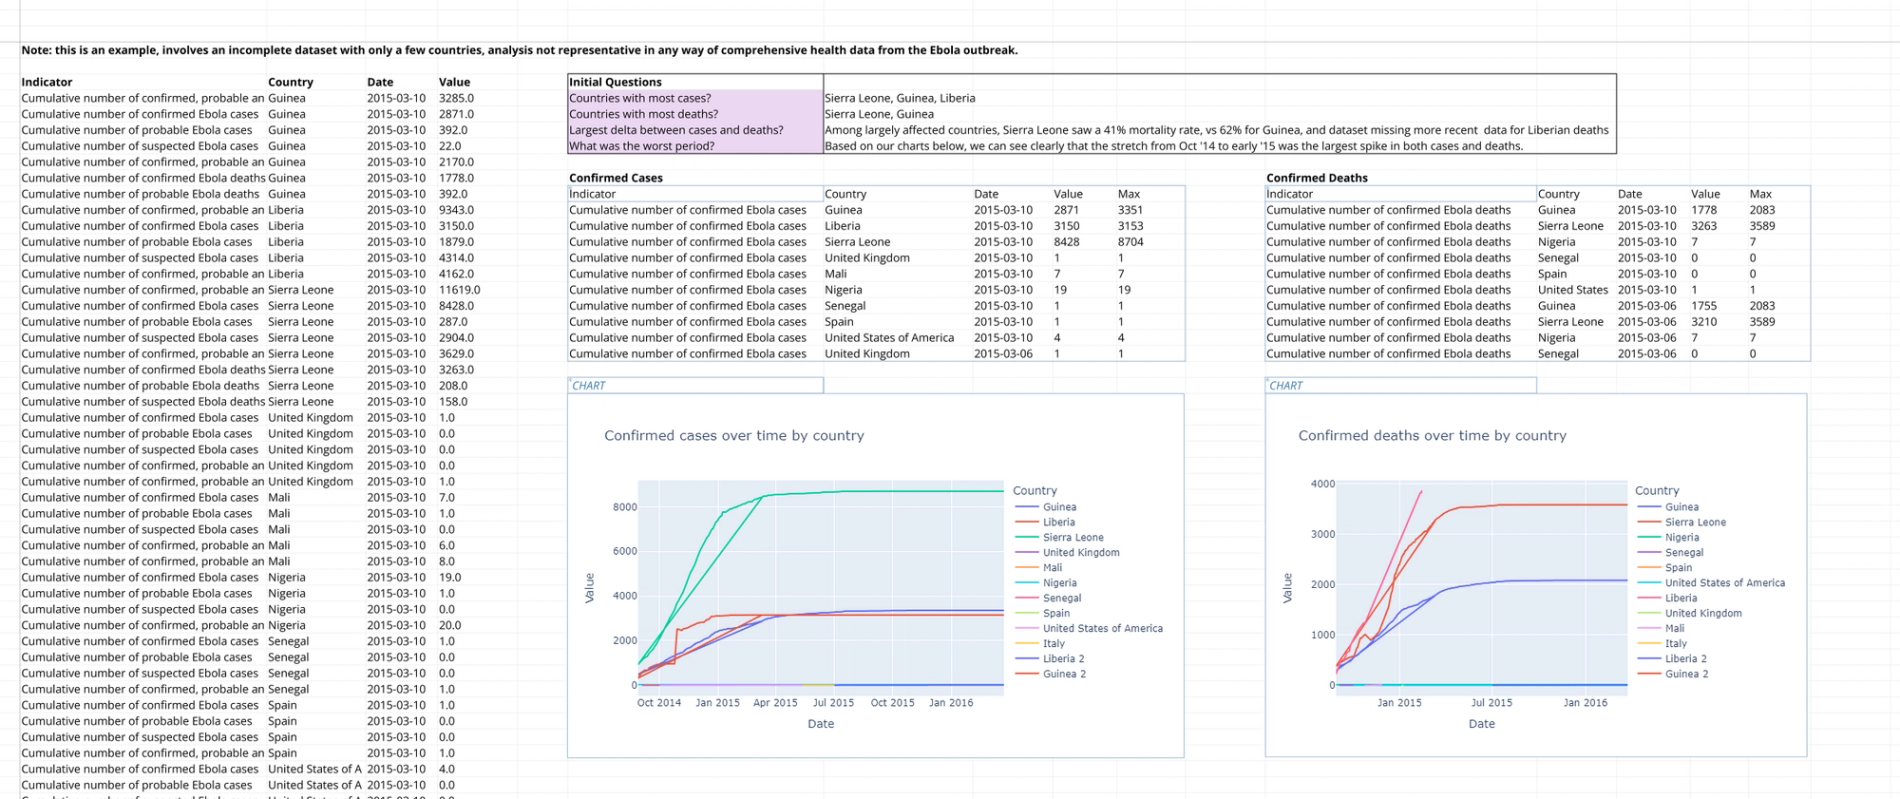
Transform complex health data into actionable insights with our comprehensive health data exploration template. This ready-to-use spreadsheet demonstrates how to analyze public health metrics using a real-world example of Ebola case data across multiple countries.
Perfect for:
- Public health analysts and researchers
- Data scientists working with healthcare datasets
- Students learning health data analytics
- Organizations tracking epidemiological trends
Key Features:
- Pre-built data structure for tracking cases and mortality rates
- Interactive Python visualizations for trend analysis
- Side-by-side comparison of confirmed cases vs. deaths
- Guided analysis framework with example questions
- Clear data organization separating raw data from analysis
How to Use:
- Input your health metrics into the organized data tables
- Leverage AI-generated charts powered by Plotly to visualize trends
- Follow the template's analysis framework to answer key questions
- Compare metrics across different regions or time periods
- Generate insights using both spreadsheet formulas and Python code
What Makes This Template Special:
- Combines traditional spreadsheet functionality with powerful Python analytics
- Visual-first approach to health data interpretation
- Structured format for comparing multiple health indicators
- Built-in documentation and example analyses
- Flexible design adaptable to various health metrics
Whether tracking disease outbreaks, analyzing public health trends, or studying healthcare outcomes, this template provides a foundation for thorough data exploration. It demonstrates best practices in health data organization while showcasing Quadratic's unique capabilities in combining spreadsheet accessibility with programming power.
Related templates

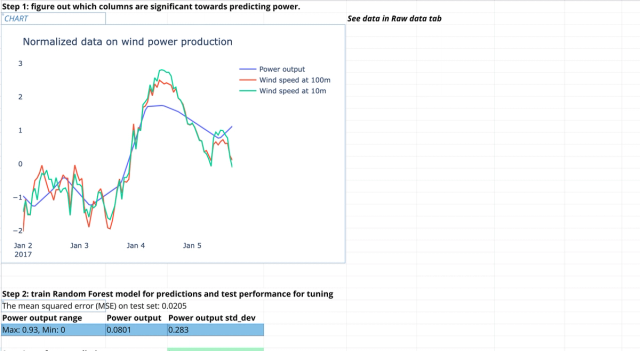
Machine Learning Tutorial Template
Build your first scikit-learn example using renewable energy data from a wind farm.

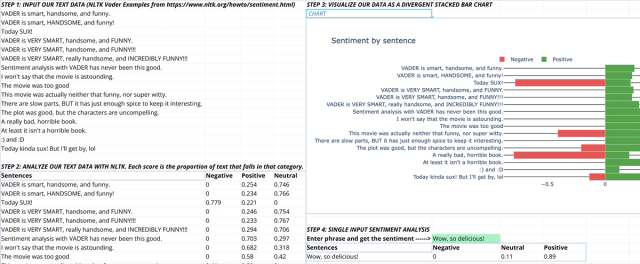
Sentiment Analysis Template
Get the sentiment of phrases in your spreadsheet from text data using NLTK.

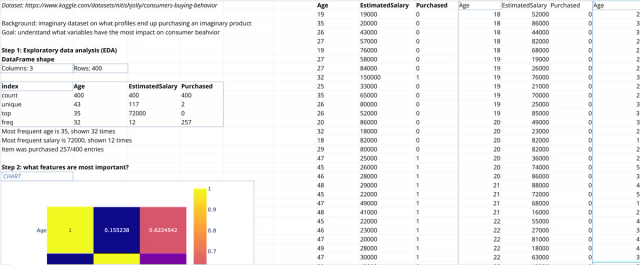
Consumer Behavior Analysis Template
Study consumer purchasing behavior to target the right consumers.
