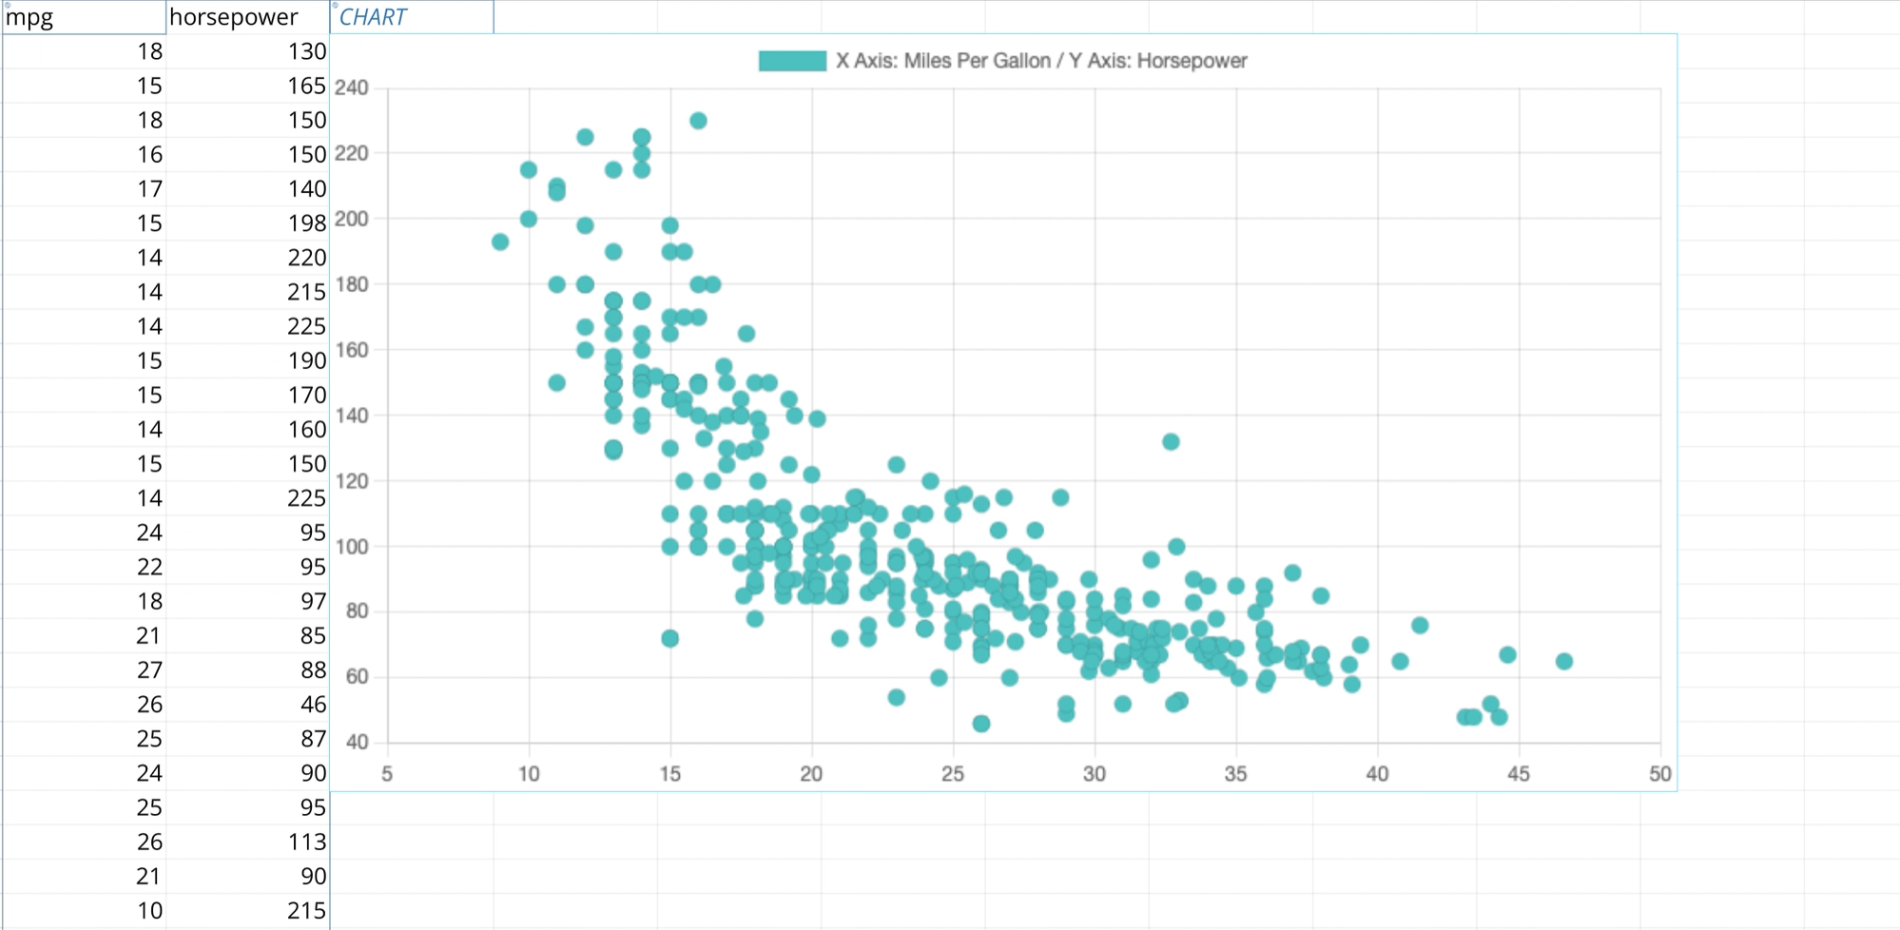
Dive into automotive performance analysis with this ready-to-use template, which demonstrates Quadratic's powerful data fetching and visualization capabilities. It is perfect for developers, data analysts, and automotive enthusiasts who want to explore the relationship between vehicle MPG (miles per gallon) and horsepower.
Key Features:
- Live API data fetching using JavaScript
- Interactive data visualization
- Real-time performance metrics
- Clean, organized data structure
This template showcases how to:
- Retrieve automotive performance data through API calls
- Structure and display MPG and horsepower measurements
- Create dynamic visualizations for trend analysis
- Implement best practices for data organization
Ideal for:
- Software developers learning API integration
- Data analysts exploring automotive trends
- Engineering students studying vehicle performance
- Automotive researchers analyzing efficiency metrics
Perfect Learning Tool
Whether you're new to Quadratic or an experienced user, this template is an excellent example of combining data fetching with visualization. It demonstrates real-world applications of spreadsheet automation and data analysis, making it an invaluable resource for understanding modern data workflows.
Technical Highlights:
- JavaScript Fetch() implementation
- Dynamic chart generation
- Structured data organization
- Performance optimization techniques
Who Should Use This Template:
- Developers exploring API integration
- Data analysts working with automotive metrics
- Students learning data visualization
- Anyone interested in vehicle performance analysis
Ready to analyze vehicle performance data? Start with this template and discover how Quadratic makes complex data analysis intuitive and efficient.


