Transform your investment research with our comprehensive Stock Market Analysis Template, designed to help both novice and experienced traders make data-driven decisions. This interactive stock market spreadsheet template combines powerful technical analysis tools with an intuitive interface, making market analysis accessible to everyone.
Key features:
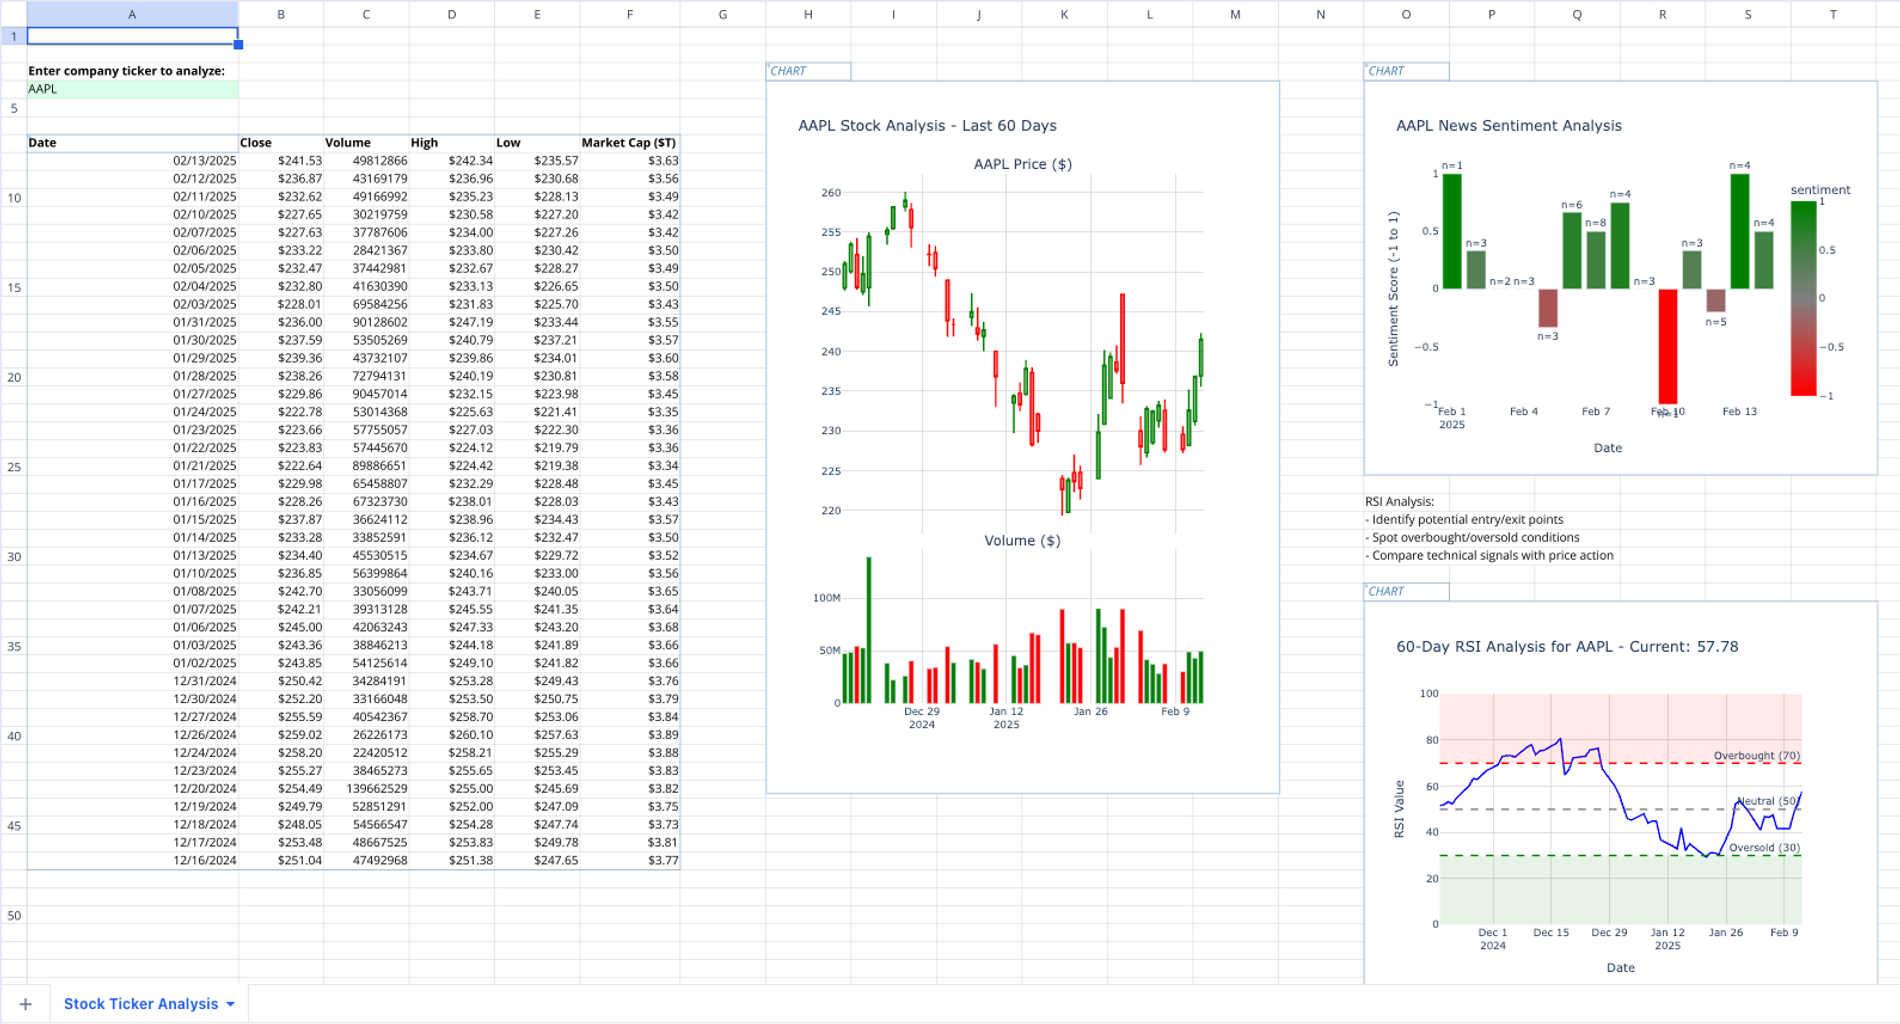
- Real-time stock data visualization based on Polygon API data
- Technical indicator calculations (RSI analysis)
- Price trend analysis with high/low tracking
- Volume analysis and market cap monitoring
- News sentiment analysis data visualization
Getting started:
- Simply enter your desired stock ticker in the designated cell
- Watch as the template automatically populates with comprehensive market data
- Analyze key metrics including closing prices, trading volumes, and price ranges
- Utilize the RSI (Relative Strength Index) indicators to identify potential entry and exit points
- Monitor market capitalization trends to understand company valuation
Perfect for:
- Individual investors seeking professional-grade analysis tools
- Day traders requiring quick technical insights
- Investment clubs analyzing market trends
- Financial advisors presenting market data to clients
- Students learning technical analysis
- New Quadratic users looking to explore API data in a spreadsheet
What sets this template apart:
Our stock market portfolio tracker combines Python-powered analytics with Quadratic's spreadsheet functionality, offering capabilities typically found in expensive trading platforms. The template features automated calculations, interactive visualizations, and overbought/oversold indicators, all updating in real-time as you analyze different stocks.
Whether you're new to technical analysis or an experienced trader, this stock market spreadsheet template streamlines your research process and helps you make more informed investment decisions. The clear layout and automated features mean less time managing data and more time focusing on market opportunities.
Ready to elevate your stock market analysis? Try this template now and experience how professional-grade technical analysis can be both powerful and accessible.


