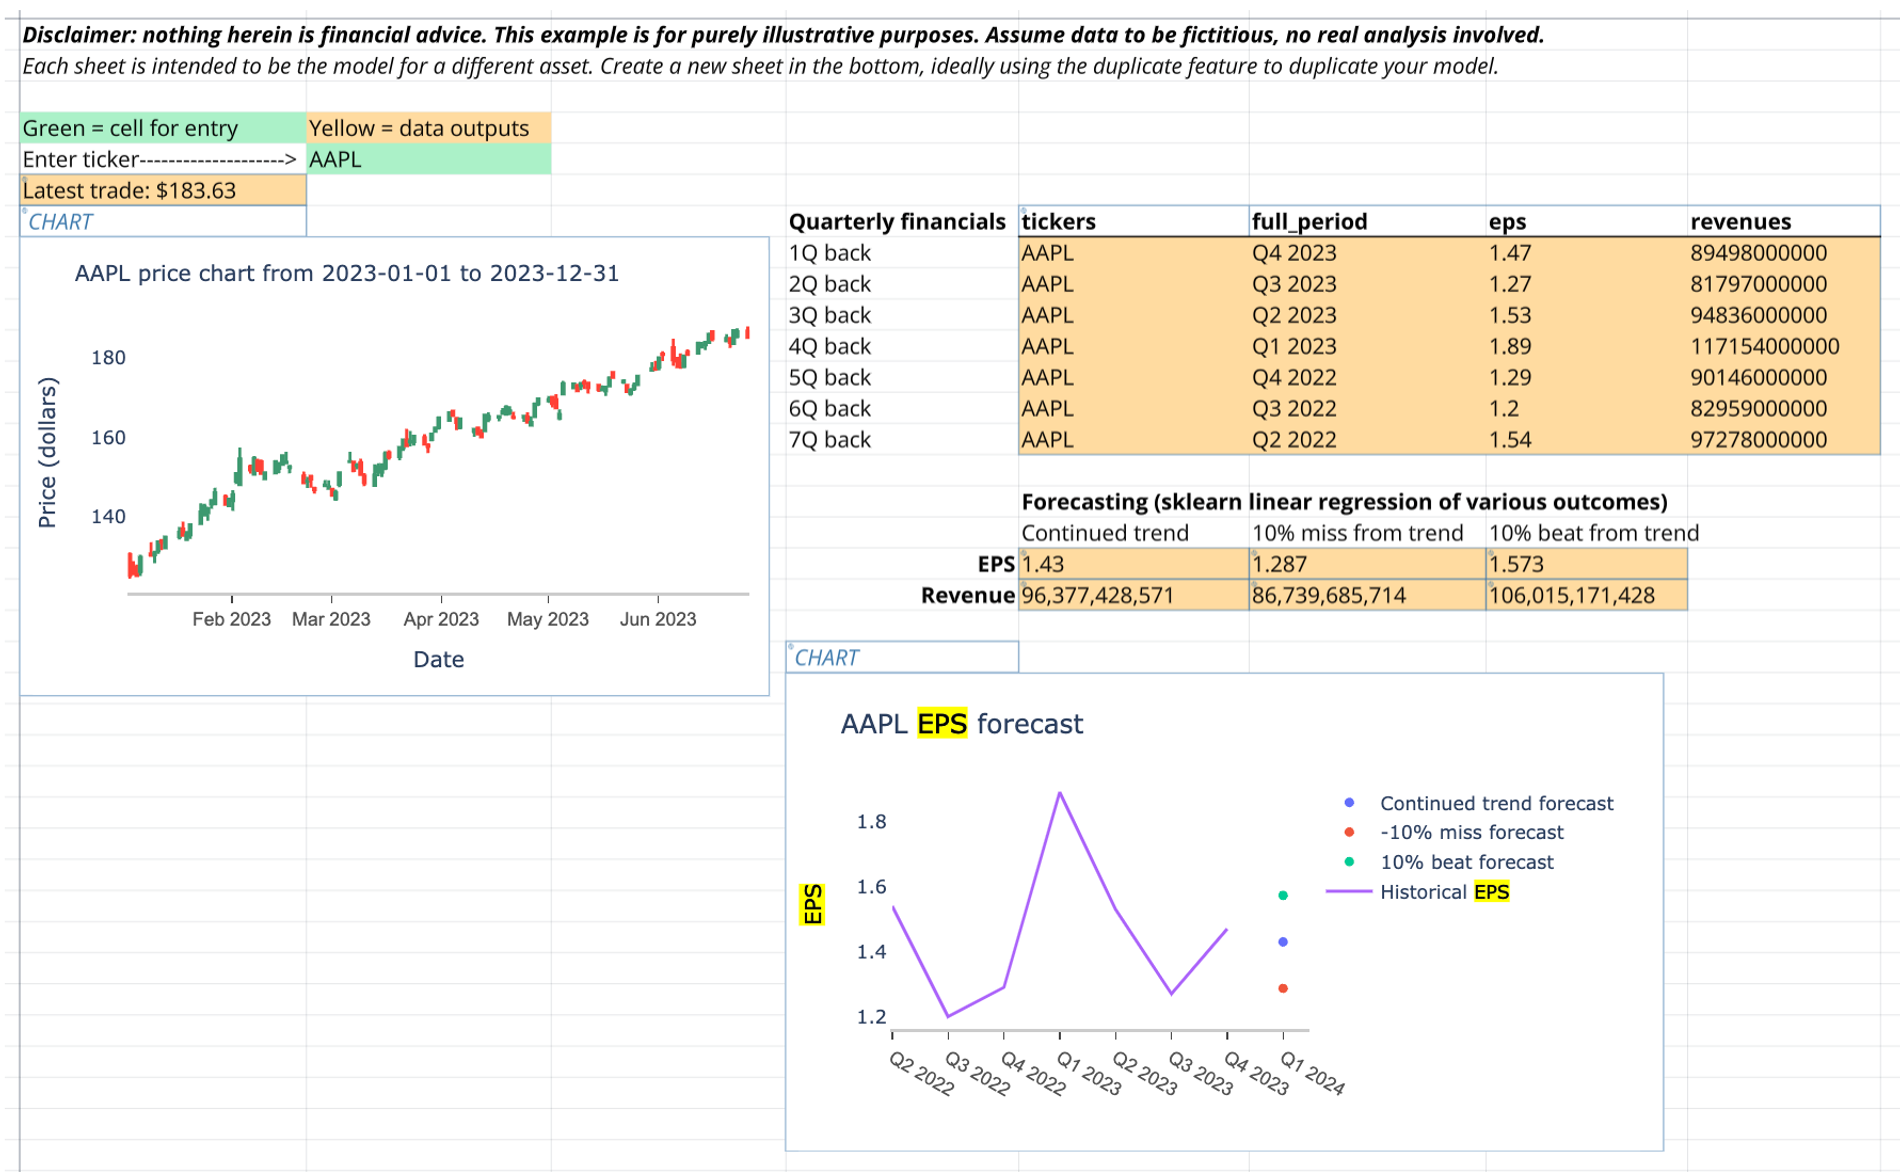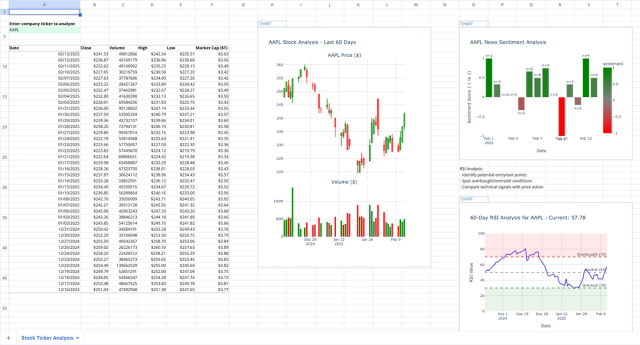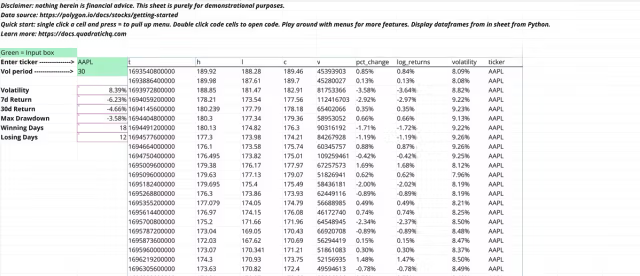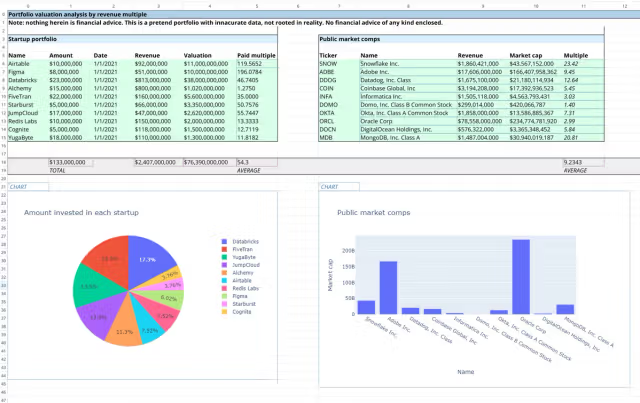
Transform your investment research process with our comprehensive asset research template to help investors and analysts make data-driven decisions. This powerful spreadsheet combines financial data analysis, trend forecasting, and visual insights in one intuitive workspace.
Key Features:
- Quarterly financial tracking for key metrics (EPS and Revenue)
- Machine learning-powered trend forecasting using sklearn
- Automated scenario analysis (±10% from trend)
- Interactive data visualization
- Multi-asset modeling capability
Perfect for:
- Investment analysts
- Portfolio managers
- Individual investors
- Financial advisors
- Research teams
How It Works:
- Input quarterly financial data for your chosen asset
- View automated trend calculations and forecasts
- Analyze multiple scenarios with built-in variance modeling
- Examine visual representations of trends and projections
- Duplicate the template to analyze multiple assets
The template leverages Quadratic's unique combination of spreadsheet familiarity and Python-powered analytics. Using sklearn linear regression, it automatically generates forecasts while allowing you to explore different scenarios through an intuitive interface.
What Sets It Apart:
- Seamless integration of Python analytics in a spreadsheet environment
- Ready-to-use machine learning models
- Visual data presentation
- Scalable for multiple assets
- Clear documentation and guidance
Best Practices:
- Regularly update quarterly data for accurate forecasting
- Use the duplicate feature to maintain separate sheets for different assets
- Leverage both trend analysis and scenario modeling for comprehensive insights
- Reference the built-in documentation for guidance
Whether you're conducting fundamental analysis, building investment theses, or tracking portfolio performance, this asset research template streamlines your workflow while providing sophisticated analytical capabilities.
Related templates

Stock Market Analysis Template
Study the markets with an interactive spreadsheet tracking any publicly traded company.

Financial Time Series Analysis Template
Perform financial analysis on equities using Python and Formulas.

Startup Portfolio Tracking Template
Track a sample venture portfolio using Python and Formulas.
