Improve your investment research with our professional-grade stock analysis template in Quadratic. This interactive spreadsheet combines real-time market data analysis with sophisticated volatility tracking, helping investors make more informed decisions about their equity investments.
Key Features:
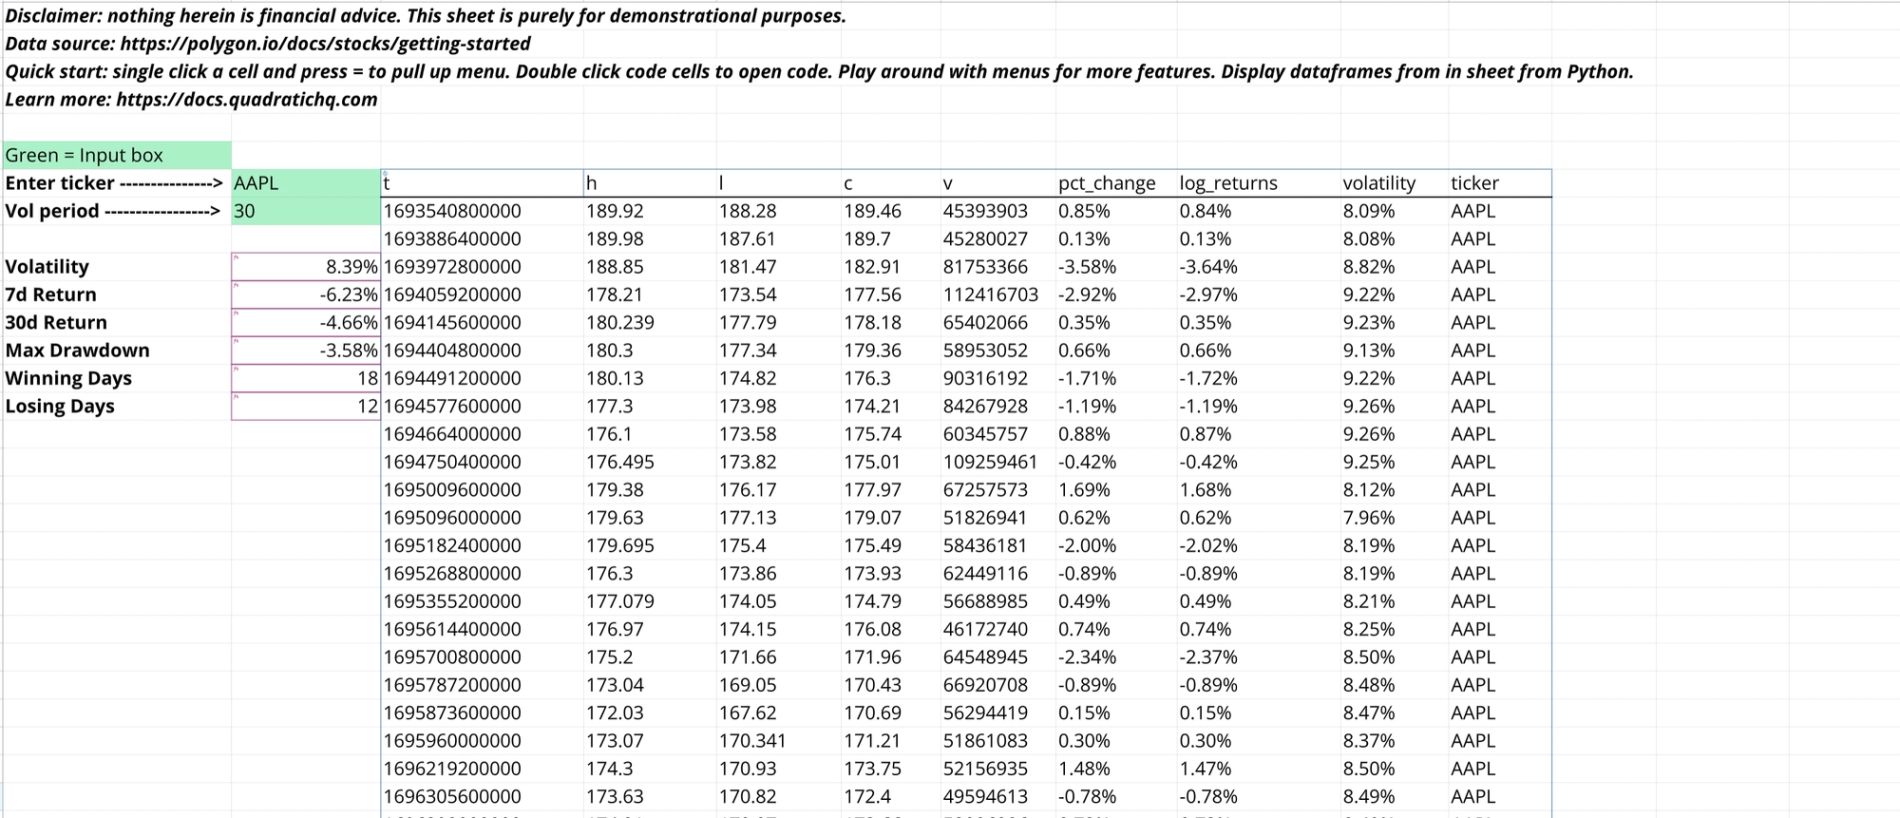
- Automated stock price tracking with high/low/close data
- Real-time volatility calculations
- 7-day and 30-day return metrics
- Volume analysis integration
- Percentage change and logarithmic returns
Perfect for:
- Individual investors tracking their portfolios
- Financial advisors presenting market analysis
- Investment analysts conducting technical research
- Students learning about market metrics
- Day traders monitoring stock movements
Getting Started:
- Simply enter your desired stock ticker in the designated input box
- Adjust the volatility period to your preferred timeframe
- Watch as the template automatically calculates key metrics
- Leverage Python-powered analysis for deeper insights
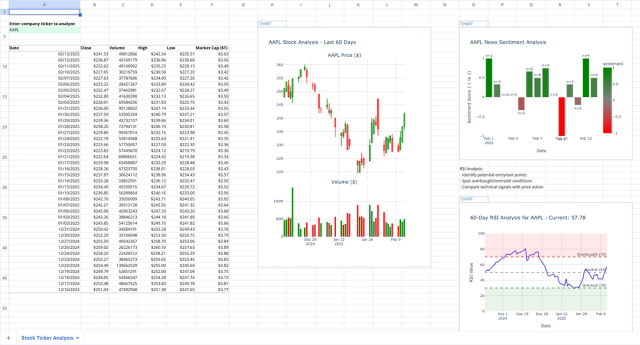
- Visualize trends through integrated data displays
What Sets This Template Apart
Unlike basic spreadsheets, this financial analysis template combines the familiarity of a traditional spreadsheet with advanced programming capabilities. The hybrid approach allows users to perform complex calculations while maintaining an intuitive interface. Whether you're tracking a single stock or analyzing market trends, the template adapts to your needs.
Technical Features:
- Python integration for advanced calculations
- Automated data updates
- Customizable analysis periods
- Professional-grade volatility metrics
- Clear data visualization options
Best Practices:
- Regularly update your tracking parameters
- Use the volatility metrics for risk assessment
- Compare multiple timeframes for comprehensive analysis
- Leverage both percentage and logarithmic returns for complete insight
Start elevating your investment analysis today with this powerful yet user-friendly template. Whether you're a seasoned analyst or just beginning your investment journey, this tool provides the perfect foundation for data-driven decision-making.
Related templates

Stock Market Analysis Template
Study the markets with an interactive spreadsheet tracking any publicly traded company.

Asset Research Template
Study a single stock with advanced analytics in Quadratic.

Crypto Spreadsheet Tracker Template
Explore crypto assets in your spreadsheet using data from Coingecko and DeFiLlama.
