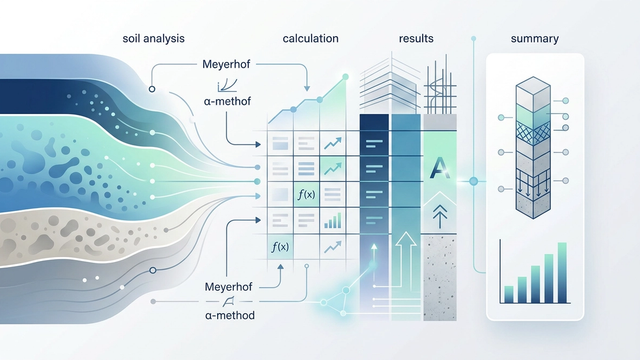
Pile driving analysis for foundation design: a modern workflow in quadratic
Simplify pile driving analysis. Integrate static soil calculations, structural code compliance, and Python plots in a single canvas.

Accounting cycle steps: how to record, adjust, and close
Learn the accounting cycle steps in order. Walk through recording journal entries, posting to the ledger, adjusting, and closing the books.

Incentive compensation calculation: a data-driven guide
Streamline incentive compensation calculations. Learn to consolidate multi-source data, apply business rules, and build clear payout reports.

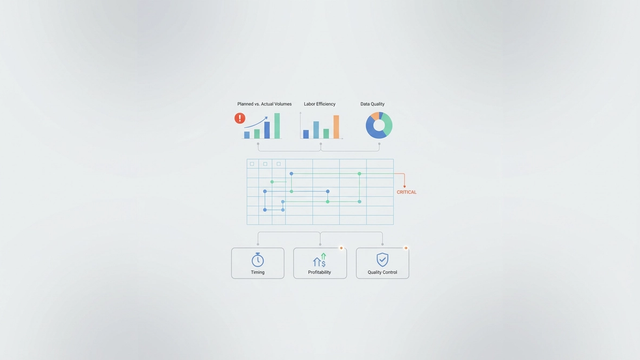
Operational performance metrics: tracking individual trends
Track and visualize operational performance metrics for individual team members. Learn how to build a unified, branded performance dashboard.

How to get real time currency exchange rates in Excel
Automate cash flow forecasts by integrating real-time currency exchange rates in Excel for dynamic, multi-currency treasury management.

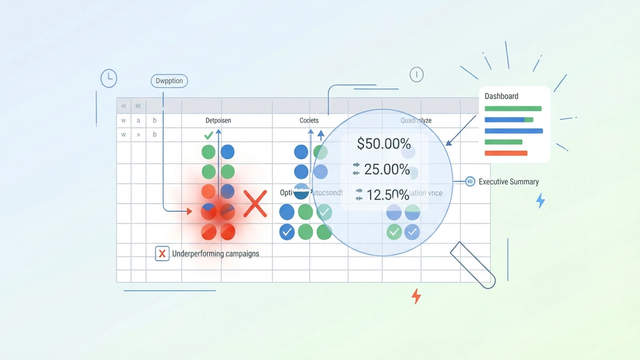
Retail media analytics: reporting PR impact to the board
Learn how to use retail media analytics to merge PR data, track key KPIs, and present compelling, data-driven reports to your board.

Working capital reconciliation: balance sheet to cash flow
Streamline working capital reconciliation. Learn to bridge the balance sheet to cash flow, avoid common errors, and optimize due diligence.

Forecast sales volume: a guide to dynamic dashboards
Learn how to forecast sales volume using dynamic dashboards that integrate SQL, Python, and spreadsheet formulas for more accurate FP&A planning.

How to build an accurate financial ratio analysis spreadsheet
Learn how to build an accurate financial ratio analysis spreadsheet. Connect financial statements, handle unit translation, and eliminate formula errors.

Structuring data analysis for systematic review
Conduct PRISMA-compliant systematic literature reviews with AI-powered deduplication, screening, live summary stats, and visual data tracking.

Tools for accuracy in payment transaction reporting
Discover how payment transaction reporting tools help finance teams automate reconciliation and build defensible audit trails.

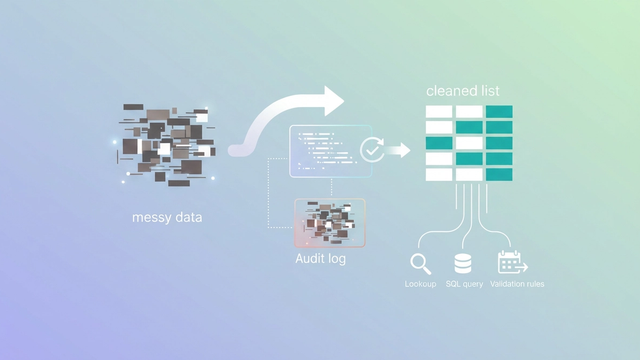
Tax expense tracker: how to organize your deductions
Learn how to use a tax expense tracker to clean messy bank transactions, accurately categorize deductions, and simplify your tax preparation.
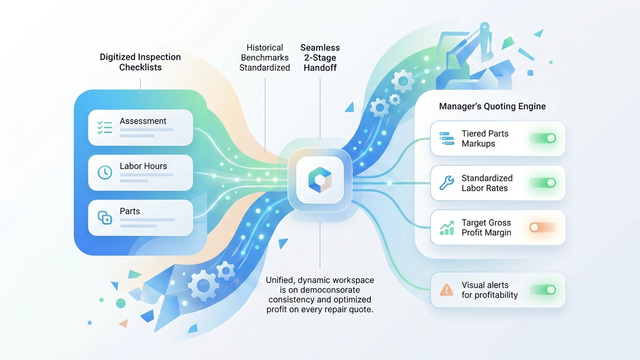
Mechanical equipment repair: streamlining workshop quoting
Streamline mechanical equipment repair quoting with digital inspections, automated pricing rules, live parts data, and profit alerts in one workspace.

Retail product data enrichment: invoice to inventory
Transform messy paper and PDF invoices into clean, actionable inventory data using a modern retail product data enrichment workflow.

Education business plan: strategic & financial guide
Build a comprehensive education business plan. Learn how to connect market analysis, curriculum design, and multi-scenario financial models.

Building a liquidity management system for cash forecasting
Build a custom liquidity management system with Python & APIs to automate cash forecasting, manage FX risk, and track cash runway.

Consumer goods market research: launch and funding guide
Use consumer goods market research to build financial models, validate unit economics, and secure funding for your CPG launch.

Master data integrity: how to audit complex workbooks
Ensure master data integrity in complex workbooks. Learn how to audit, clean, and validate spreadsheet logic using a modern, code-driven workflow.

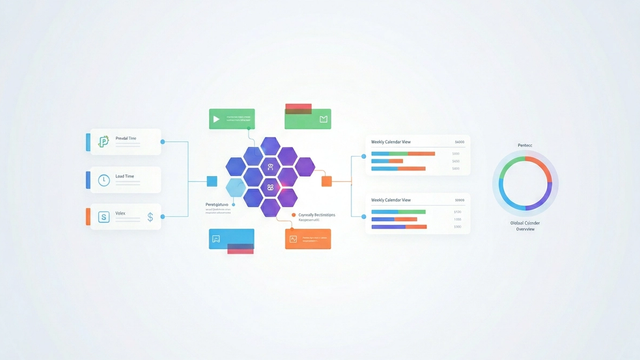
Instructor scheduling software for multi-site timelines
Learn how to build scalable multi-site timelines, clean messy data, and allocate resources efficiently using modern instructor scheduling software.

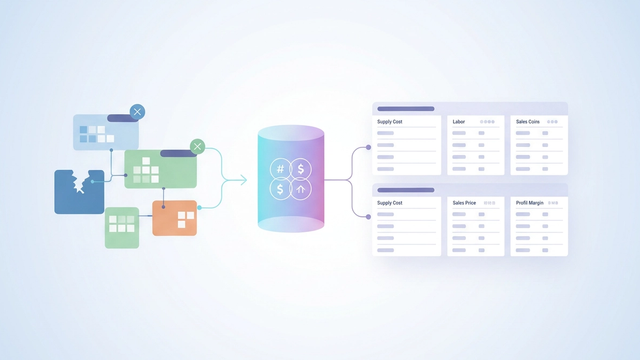
How to build fence quoting software in spreadsheets
Learn how to build custom fence quoting software in spreadsheets. Consolidate supplier pricing, automate calculations, and eliminate formula errors.

Financial analysis for stocks: a guide to investment research
Upgrade your workflow for financial analysis for stocks. Learn how to build dynamic models, integrate live data, and streamline investment research.

P&L statement analysis: how to analyze profitability trends
Learn how to perform a P&L statement analysis to evaluate key margins, identify cost drivers, and visualize multi-year profitability trends.
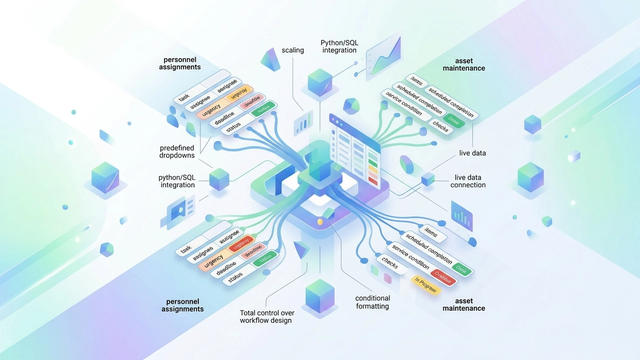
Operations management software for workflow tracking
Build a flexible operations management software system in Quadratic to track tasks, manage physical assets, and streamline your team's workflow.

Dynamic homeschool attendance: building a clean, adaptive planner
Struggling with homeschool attendance? Build a dynamic, automated Quadratic planner. Adapts to your schedule, hides clutter, keeps data front and center.

Spa financing: budgeting & cash flow for resort projects
Robust financial modeling is key for spa financing. Build multi-year models for wellness resorts & med spas, covering investments, cash flow, and scenario analysis.
Recipe costing: fix formula errors & format cards
Master accurate recipe costing: fix formula errors, clean vendor data. Build professional recipe cards for your restaurant's profitability.

HVAC duct calculator: rounding up area & volume for accuracy
Learn why accurate rounding in your hvac duct calculator prevents material underestimation. Discover how modern tools ensure precise area and volume calculations.
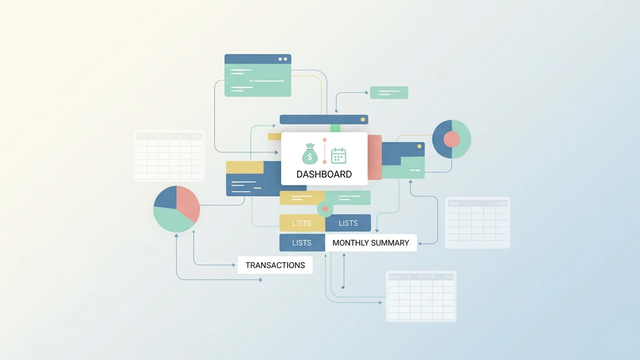
Personal finance tracker: building a dynamic budget dashboard
Learn to build a modern personal finance tracker and dynamic budget dashboard in Quadratic. Go beyond old spreadsheets with visible formulas and a clean UI.

Annuity valuation: lottery, retirement & endowment analysis
Accurate annuity valuation for lottery, retirement, & endowment planning. Learn how advanced tools combine spreadsheets & Python for dynamic financial analysis.

Effective HR data analytics: visualizing workforce trends
Learn effective hr data analytics to visualize workforce trends like headcount and attrition. Create clear, executive-ready charts for strategic decision-making.
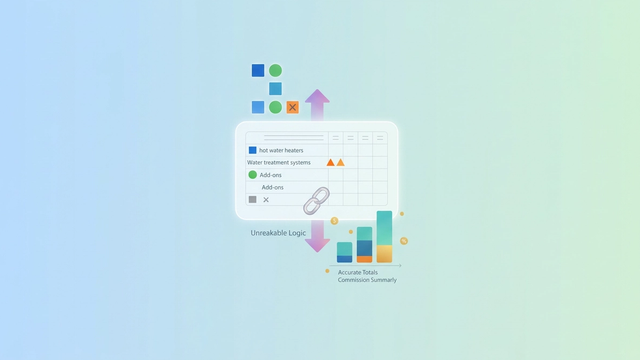
Commission pricing: flawless sales calculator updates
Learn how to make flawless updates to your commission pricing structures in sales calculators without breaking formulas.
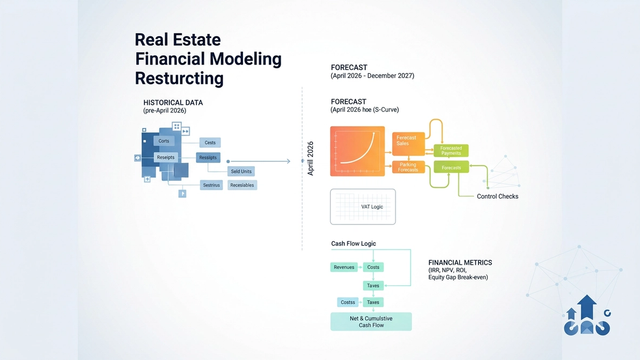
Real estate financial modeling: how to set up a forecast-only model
Boost real estate financial modeling with our forecast-only model setup. Separate historical data from future forecasts for unmatched clarity & accuracy. (155)

Stock control spreadsheet: build a complete inventory system
Build an advanced stock control spreadsheet for inventory management. Design an app-like interface, track stock movements, and gain insights for your logistics.

Wedding planner spreadsheet: comprehensive & interactive design
Build a comprehensive wedding planner spreadsheet using Quadratic. Track budget, RSVPs, and vendors with an interactive, visually stunning tool.
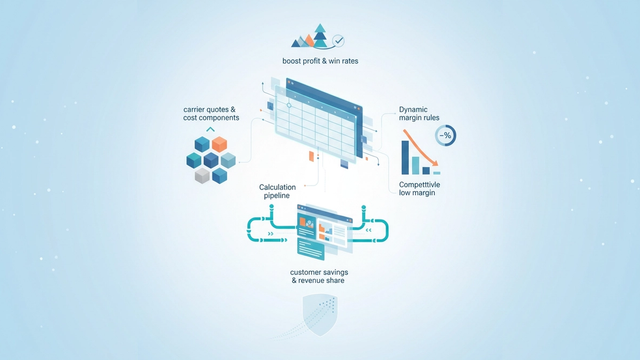
Freight spend analysis: boost profit & win rates
Boost profit & win rates with freight spend analysis. A modern approach handles complex data to optimize lane-level margins & improve decision-making.

Retail financial planning: modeling & bond valuation
Learn modern retail financial planning with integrated modeling. Explore data extraction, EBITDA forecasting, and bond valuation in one cohesive workspace.
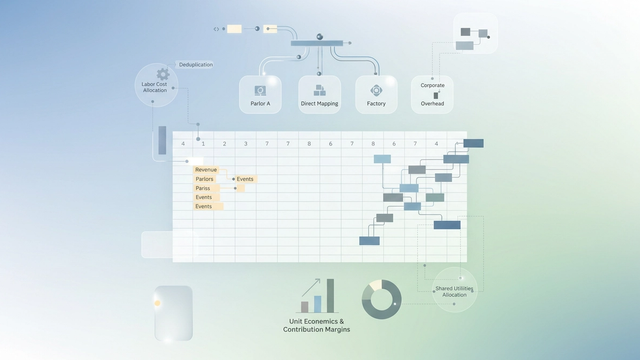
Ice cream economics: mastering multi-unit p&l & cost allocation
Navigate the complexities of ice cream economics for multi-unit brands. This guide helps you build accurate P&L statements & allocate shared costs for profitability.

Tutoring english lesson plans: structured & exam board aligned
Create structured, exam-aligned English tutoring lesson plans. Dynamic curriculum databases streamline planning, ensure syllabus coverage & automate scalability.

Real estate lead tracking: build an automated spreadsheet CRM
Build an automated real estate lead tracking spreadsheet CRM. Implement databases, Python follow-ups, & visual dashboards for efficient lead management.

How to build a comprehensive employee attendance management system
Build a flexible employee attendance system with Quadratic. Manage schedules, calculate timesheets, track leave, and integrate forms for accurate HR data.

Cash flow projection: fix errors for project planning
Master cash flow projection by fixing common data errors. Build multi-year models, visualize financial health, and run advanced loan scenarios for project success.

Operational performance report: how to audit formula accuracy
Uncover risks in your operational performance report. Audit formula accuracy, avoid spreadsheet errors, and ensure reliable data for critical e-commerce decisions.

Optimize your final exam study plan spreadsheet
Struggling with a messy final exam study plan? Learn to optimize your study tracker, fix errors, and visualize progress for a stress-free exam season. Get organized!

Ecclesiastical titles: accurate assignment for saints
Ensure accuracy assigning ecclesiastical titles to religious figures. Learn data cleaning, categorization, and precise validation for historical archives.
Manufacturing planning and scheduling: capacity & calendars
Discover how effective manufacturing planning and scheduling can optimize capacity. Learn to automate date math and visualize your production calendar clearly.

Tax return presentation: format excel for clarity & audit
Transform messy Excel data into clear, audit-ready docs. Learn step-by-step formatting for clarity & efficient review of tax return presentation.
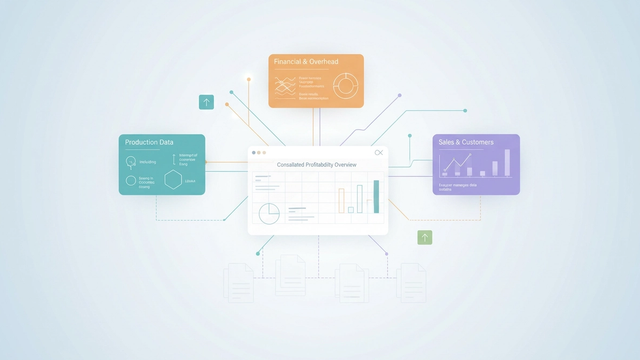
Cost analysis manufacturing: uncover profitability & costs
Master manufacturing cost analysis. Consolidate data, categorize expenses, track metrics to uncover profitability & drive decisions.

Cost estimate analysis: build an executive sales dashboard
Build an executive sales dashboard from fragmented data. Streamline cost analysis, fix errors, and gain real-time insights for decisions.
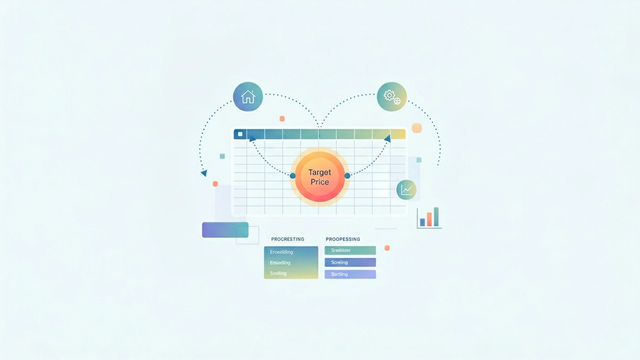
How to generate a house price dataset for ML
Generate a custom house price dataset for ML practice. Control data complexity, practice preprocessing, and understand ML models with this step-by-step guide.

NBA fantasy injuries: daily strategy for lineup success
Master NBA fantasy injuries with daily strategy. Learn to react to player absences, identify usage spikes, and build optimal lineups using advanced analytics.

Managed funds performance: from data to decision
Improve managed funds performance with a unified workflow. Connect data reconciliation & reporting to reduce errors, speed up insights, and make better decisions.

Clinical trial data extraction: from PDFs to structured spreadsheets
Automate clinical trial data extraction from PDFs. Manual is slow & error-prone. Get structured data fast, reduce errors, and save time for systematic reviews.

Loan repayment planner: optimize your debt strategy
Build a custom loan repayment planner to manage all your debts, model payoff strategies like snowball/avalanche, and optimize your path to financial freedom.
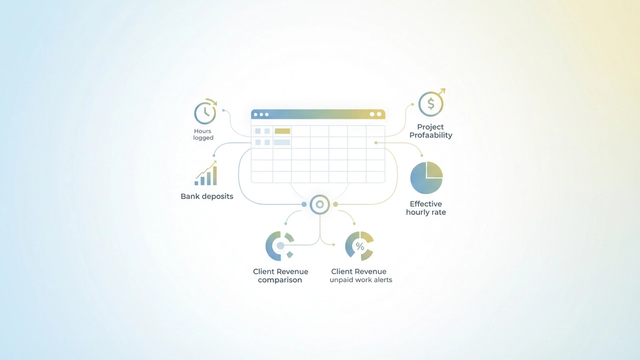
Freelance time tracking: link hours to profit & pay
Optimize your freelance time tracking. Learn how to connect logged hours to actual profit & pay using a connected spreadsheet for real-time financial insights.

Portfolio rebalancing tool: rebalance with precision
Build a custom portfolio rebalancing tool in Quadratic. Sync live data, calculate drift, rebalance contributions for tax efficiency, gaining precise control.

Vacation tracker: budget, monitor, and save on travel
Manage travel finances with our tracker. Budget, monitor spending, save on every trip. Avoid financial stress.

Couples budget template: manage joint & personal finances
Use a couples budget template to manage joint and personal finances with ease. Automate tracking, maintain autonomy, and achieve financial harmony.

Rent vs buy calculator: is buying sustainable for you?
Most rent vs buy calculators miss sustainability. Our data-connected calculator reveals true affordability & cash flow for your home purchase.

Mortgage with interest calculator: compare loans & payments
Use our transparent mortgage calculator to analyze loan payments, interest, taxes, and principal. Understand true affordability.

Savings account interest calculator: plan your cash growth
Calculate savings account interest with a tool that syncs live bank data. Plan cash growth, compare high-yield accounts, and track financial goals.

Loan interest calculator: analyze & compare your loan costs
Beyond static tools. Our custom loan interest calculator helps analyze costs, model extra payments, and track real-time progress for smarter debt management.

Car loan interest rate calculator: estimate payments & save
Assess car loan affordability with our interest rate calculator. Model payments, visualize cash flow, and make informed car buying decisions.

Compound interest calculator: model savings & investment growth
Model savings & investment growth with our compound interest calculator. Connect live data, run Python projections, and visualize your financial future.

Debt avalanche calculator: optimize payoff & save interest
Optimize debt payoff with our debt avalanche calculator. Save on interest & reach financial freedom faster. Build a dynamic, adaptive tool.

Credit utilization calculator: track & reduce your usage
Build a dynamic credit utilization calculator to track usage in real-time. Plan payments strategically, avoid errors, and optimize your credit score effectively.

How to master transaction tracking in one spreadsheet
Track transactions with a coded spreadsheet. Automate data ingestion, categorization & analysis with Python & SQL for a unified, scalable ledger.
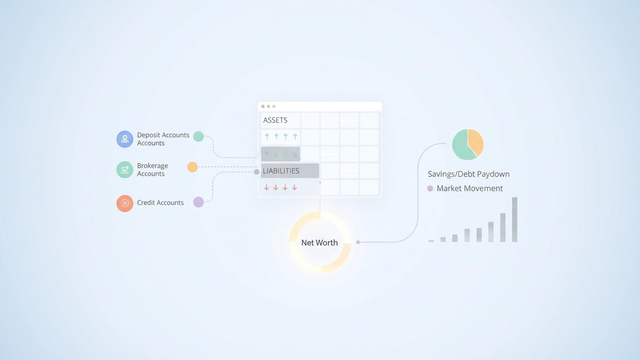
Your net worth calculator: sync, track, & plan finances
Use a net worth calculator that syncs automatically. Track assets & liabilities, analyze financial health, and plan your future with a flexible, custom solution.

Daily cash flow calendar: avoid overdrafts & plan spending
Learn how a cash flow calendar helps you avoid overdrafts and plan spending by forecasting daily balances. See why it's better than a budget for financial liquidity.

Bank account tracker: unify & monitor all your accounts
Create a bank account tracker in Quadratic. Unify accounts, automate Python anomaly detection, and visualize cash for smarter decisions.

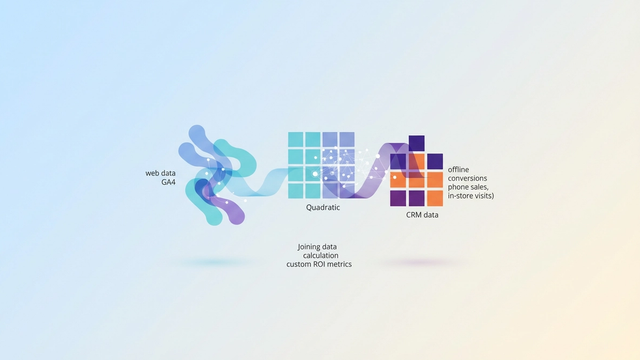
Import offline sales into Google Analytics for full attribution
Import offline sales to Google Analytics for full attribution. Learn to clean, map, validate data for GA4, ensuring accurate ROAS & a complete customer journey.

Facebook and Google Analytics: blended campaign ROI
Unify Facebook Insights & Google Analytics data. Combine ad spend & site conversions for an accurate view of marketing ROI & campaign performance.

Hootsuite & Google Analytics: connect social to conversions
Learn how to connect Hootsuite and Google Analytics data to measure social media ROI. Move beyond vanity metrics to track conversions and prove marketing value.

Subscription tracking tool: manage recurring charges with quadratic
Build a custom subscription tracking tool with Quadratic. Automate data, normalize merchants, detect price hikes. Manage recurring charges effectively.

Cash flow forecast: your household financial roadmap
Go beyond budgeting with a cash flow forecast. Predict future balances, prevent shortfalls, and manage your household finances proactively for peace of mind.

Emergency fund tracker: how many months are you covered?
Stop guessing your financial runway. Learn how a dynamic emergency fund tracker uses real-time data to show exactly how many months of expenses you have covered.

Irregular income budget: master your variable income
Manage your irregular income budget effectively. Learn to automate data, set baselines, and smooth variable income for financial stability.

Wedding spending spreadsheet: manage your budget & payments
Manage your wedding budget with an automated wedding spending spreadsheet. Sync bank data for real-time tracking, eliminate manual entry, and gain peace of mind.

Zero-based budgeting: assign every dollar, track & reallocate
Unlock total financial control with zero-based budgeting. Learn how to automate tracking, assign every dollar, and dynamically reallocate funds for wealth building.

Runway calculation: project your personal cash runway
Learn how to perform a personal runway calculation to understand your financial freedom. Model your cash flow & expenses to strategically plan life pivots.

Paycheck budget planner: sync, track, & save automatically
Master your finances with a paycheck budget planner. Sync accounts, map obligations, automate tracking for clear cash flow & stress-free spending.

50 30 20 calculator: auto-track & rebalance your budget
Tired of static tools? Build a living 50 30 20 calculator that auto-tracks spending, categorizes transactions, and alerts you to stay on budget.

Sinking fund: plan & track future expenses
Master the sinking fund concept to plan and track future expenses like holidays, subscriptions, and repairs. Learn dynamic tracking for financial control.
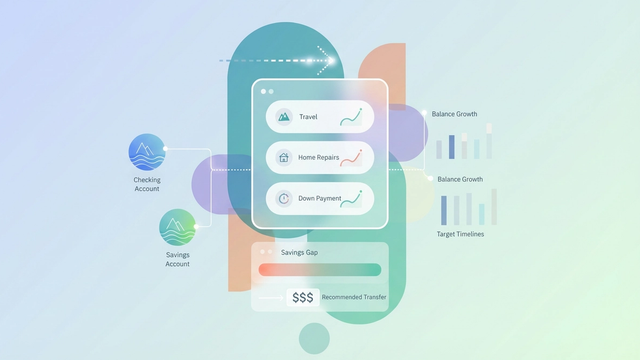
Savings goal tracker: optimize your path to financial goals
Optimize finances with a dynamic savings tracker. Connect live data, analyze savings gaps, get recommendations to meet goals.
Google Analytics offline conversions: beyond web ROI
Track Google Analytics offline conversions to bridge the web-to-sales attribution gap. Get a holistic view of your marketing ROI.
Export Google Analytics data for flexible, structured analysis
Export GA4 data to overcome sampling & retention limits. Discover a flexible workflow to clean, structure, & analyze your data using Python & SQL.
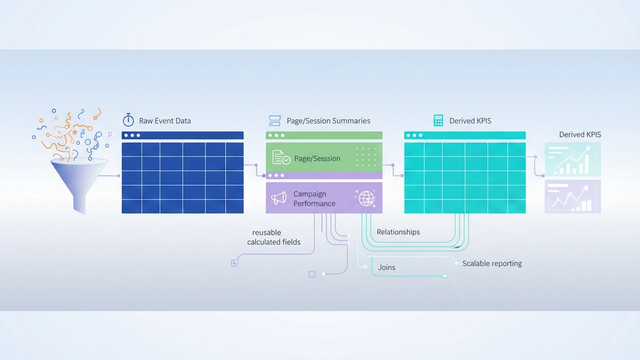
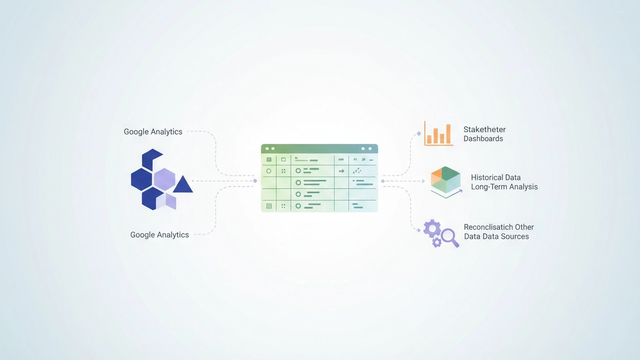
Design a Google Analytics data model for clean GA4 analysis
Design a GA4 data model. Transform raw GA4 events into clean, queryable structures for accurate, deep analysis, eliminating complex engineering.

Real-time Google Analytics data in Microsoft Excel for rapid response
Eliminate GA4 data latency. Integrate real-time Google Analytics data in Excel for immediate campaign monitoring & agile decisions.

Google Analytics pivot table: custom GA4 data reporting
Learn to build a GA4 pivot table using native Explorations. Get flexible, custom data reporting, overcoming GA4 limitations.

Category spend analysis: spot overspending & save
Use category spend analysis to find overspending. Automate tracking, categorize transactions, and visualize spending to save money and achieve financial goals.

GA4 funnel exploration: custom analysis & reporting
Go beyond native GA4 funnel exploration. Learn to sync raw data for custom, unsampled analysis, and auditable reports with Python & SQL.

AI dashboard for GA4: automated trends & insights
Discover how an AI dashboard GA4 transforms analytics from reactive to proactive. Automate trends, flag anomalies, and get plain-English insights instantly.

Master recurring charges: budget, track, and save
Master recurring charges to budget, track, and save money. Learn to manage fixed and variable expenses effectively with a programmable financial system.

Google Analytics spreadsheet: custom GA4 reports & analysis
Move your GA4 data to a google analytics spreadsheet for flexible, custom reports. Clean, analyze, and visualize data without native UI limits.

Customer lifetime value Google Analytics: beyond GA4 data
Unlock accurate customer lifetime value Google Analytics. Learn why GA4 data alone is insufficient and how to blend acquisition data with real revenue.

Custom dashboard Google Analytics: tailor GA4 for your KPIs
Unlock deeper insights with custom GA4 dashboards. Go beyond native reporting using Python & SQL to tailor reports to your KPIs and automate analysis.
Mathematical ChatGPT: step-by-step verified analysis
Solve math with ChatGPT reliably. Learn how a code-backed environment ensures verified results, eliminating AI hallucinations for students and analysts.
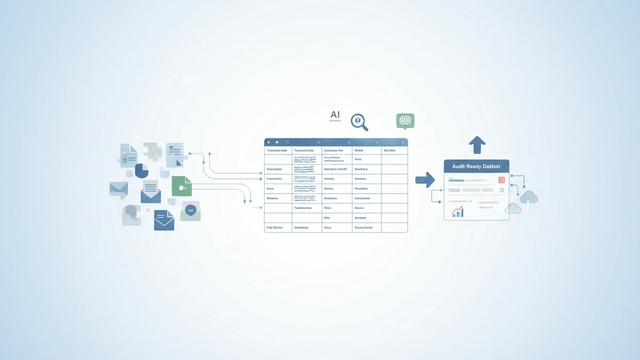
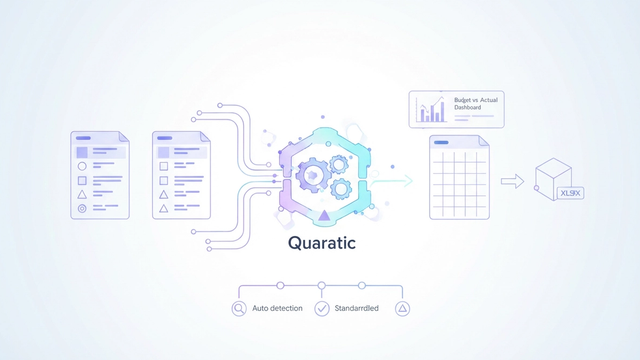
Unstructured data management: extract & standardize compliance data
Manage unstructured data for compliance. Extract, standardize, and validate critical data with our workflow, turning dark data into audit-ready insights.

Automated sales funnel: data-driven performance & forecasts
Redefine your automated sales funnel. Ingest data, calculate metrics, generate AI narratives for accurate, self-updating sales forecasts & strategy.

Data hygiene tools: clean & optimize your CRM data
Data hygiene tools combat bad CRM data. Learn a workflow to audit, clean, & prioritize customer data for accurate forecasts & boosted revenue.

AI data management for usable spreadsheet data
Discover how AI data management transforms spreadsheets into intelligent tools. Automate cataloging, schema mapping, & data quality checks for reliable, usable data.

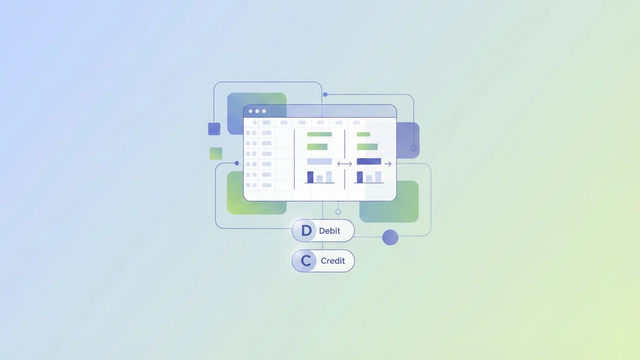
Accounting spreadsheet: automated bookkeeping & reporting
Upgrade your accounting spreadsheet with automation. Reduce manual entry, ensure accuracy, and generate financial reports easily for your small business.
Combine multiple excel files into one with schema drift
Combine multiple Excel files into one, even with schema drift. Consolidate data without manual errors or broken links.

Chatgpt alternative: AI that sticks to your data
Discover a powerful ChatGPT alternative for data professionals. Quadratic integrates AI directly into your spreadsheet for verifiable and secure data analysis.
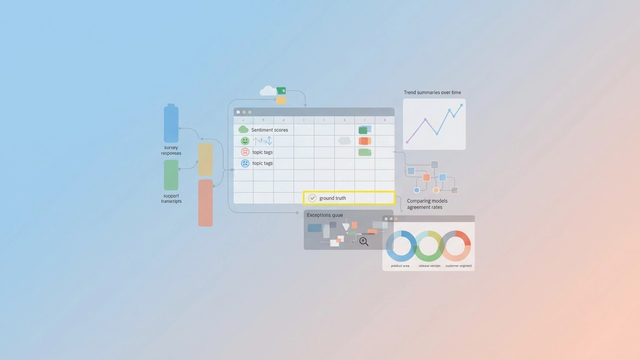
Sentiment analysis software: evaluate for customer insights
Don't just trust sentiment analysis software. Discover how to audit and calibrate tools for accurate customer insights from your qualitative data.

AI product description generator: scale & brand consistency
Scale product descriptions for enterprise ecommerce. Maintain brand consistency, compliance, & streamline content with a custom AI spreadsheet.

Phone number extractor: clean unstructured contact data
Learn to use a phone number extractor workflow to clean, validate, and standardize contact data into E.164 format. Transform messy text for CRM readiness.

Marketing automation tools: compare, evaluate, & select
Evaluate & select marketing automation tools for your stack with a dynamic, AI-powered decision matrix. Make confident choices.

Data validation: stop spreadsheet errors & compliance issues
Robust data validation prevents spreadsheet errors & ensures compliance. Implement 'Golden Schema' for data integrity & automated error resolution.

Customer data management: build a 360° customer view with AI
Master customer data management with AI. Unify customer data, automate data hygiene, and build a 360° customer view without complex code.
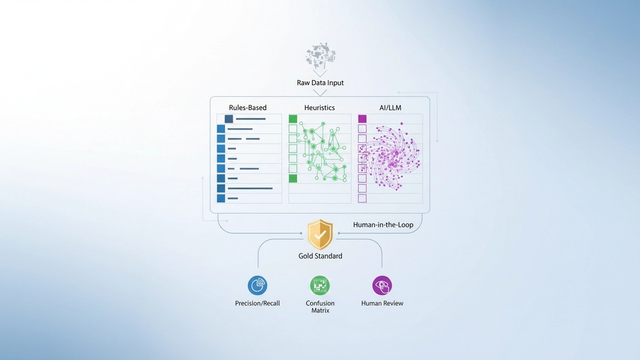
Business category classification methods: AI & rule-based accuracy
Explore business category classification. Compare AI, rule-based, & heuristic methods for accurate financial data & transaction categorization.
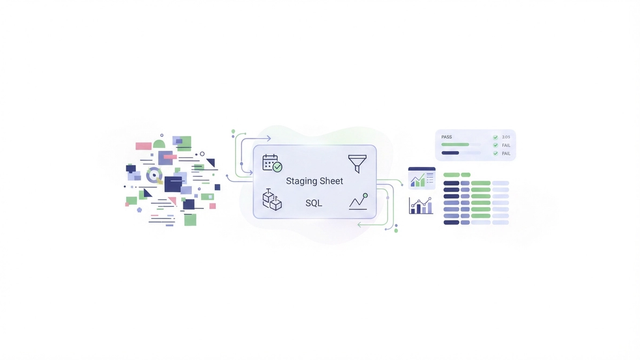
Data cleaning tips before visualization: automated quality checks
Discover essential data cleaning tips before visualization. Learn to automate data quality checks using a Staging Sheet with Python/SQL for efficient reports.

Gross margin vs net margin: calculate & explain variances
Understand gross vs net margin. Learn to calculate these key metrics, explain variances, and automate analysis for deeper financial insights.

Defining personal vs business expenses: an automated system for founders
Stop manual tax prep! Automate defining personal vs business expenses with a logic-based system for founders. Save time & reduce errors.

Month end close checklist: tasks, tracking, & leadership sign-off
Revolutionize your month end close checklist from static to dynamic. Learn to connect tasks to data, automate status updates, and simplify leadership review.

Chart of accounts mapping: ensure accurate migrations
Ensure accurate ERP migrations with effective chart of accounts mapping. Learn how to clean, map, and validate financial data for a seamless transition.

Streamline paying sales tax in multiple states: a data-first approach
Simplify paying sales tax in multiple states for DTC brands. Consolidate transaction data, apply rates, and ensure audit-ready compliance.

Prepaid expense tracker: amortization, journal entries & balance sheet
Discover how a robust prepaid expense tracker streamlines amortization calculations, automates journal entries, and simplifies month-end reconciliation.
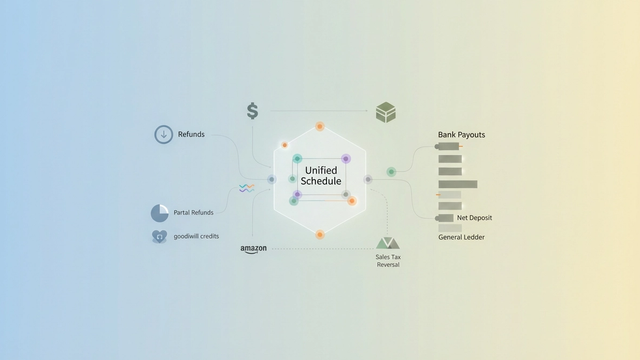
Accounting refunds: track & reconcile for sellers
Track & reconcile accounting refunds for e-commerce sellers. Automate data, categorize, ensure accurate financial reports, and prevent revenue leakage.
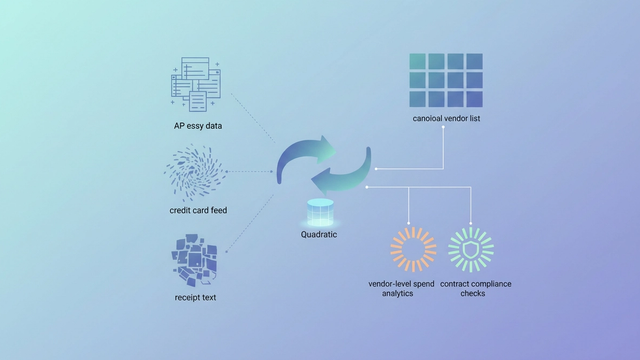
Vendor name normalization: standardize for spend analytics
Learn how vendor name normalization standardizes messy financial data for accurate spend analytics. Consolidate vendor records for better insights and compliance.
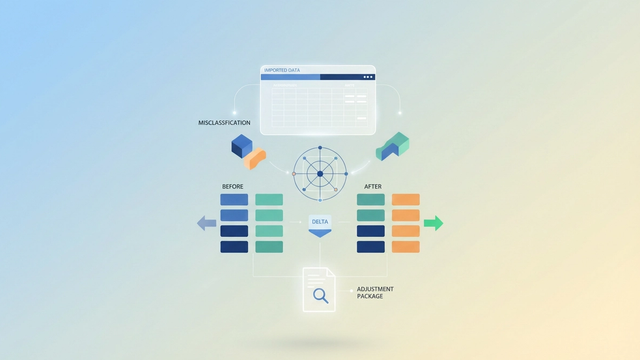
Correct prior year accounting errors: the adjustment process
Correct prior year accounting errors with a modern, data-connected workflow. Build audit-proof adjustment packages and ensure data integrity.

Effective handling chargebacks: e-commerce impact & root cause
Master e-commerce chargeback strategies. Centralize data, link disputes to sales, and identify root causes to prevent losses & optimize operations.
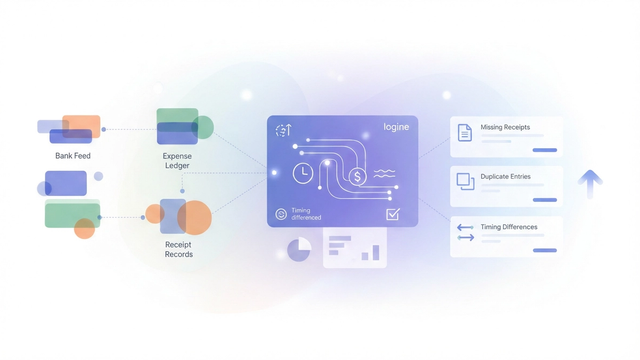
Reconcile credit card: match transactions & fix discrepancies
Reconcile credit card statements. Automate transaction matching, fix discrepancies, and improve audit readiness with our modern solution.

Splitting transactions: accurate allocation for clean books
Master splitting transactions to ensure accurate financial reporting, client billing, and tax compliance. Learn how to allocate expenses precisely for clean books.

Automate transaction categorization for tax prep
Gain control over automated transaction categorization for tax prep. Build a transparent system to clean data, define rules, and ensure audit-ready financials.

Scenario analysis: model & compare operating financials
Learn scenario analysis in financial modeling. Build dynamic models to compare Base, Upside, & Downside financials. Navigate uncertainty.
Python remove duplicates from list with order & audit log
Efficiently python remove duplicates from list. Preserve data order and generate an audit log for transparency and compliance in your data cleaning.

Cleaning transaction descriptions in financial data: reconcile faster
Streamline cleaning financial transaction data. Covers noise stripping, tokenization, & normalization for faster, audit-proof reconciliation using Quadratic.

Consolidation of financial information for unified reporting: a connected approach
Streamline financial info consolidation with a connected spreadsheet workflow. Gain transparency, automation, and traceability for unified reporting.
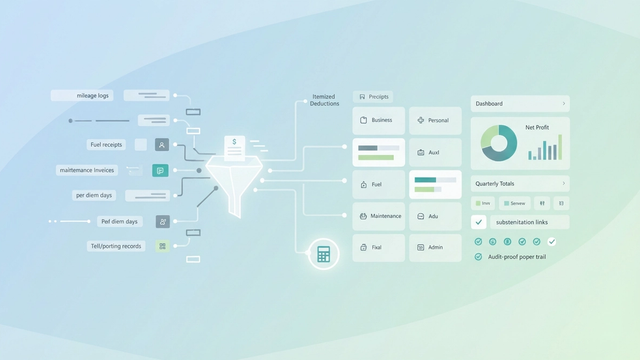
Truck driver itemized deductions: maximize your tax savings
Maximize tax savings with essential truck driver itemized deductions. Track expenses effectively and reduce your taxable income as an owner-operator.
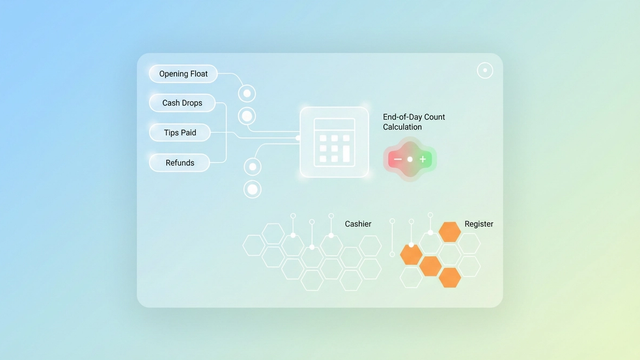
Daily cash log: track restaurant cash & spot variances
Implement an automated daily cash log to accurately track restaurant cash flow, identify discrepancies, and prevent profit leaks. Improve financial control.
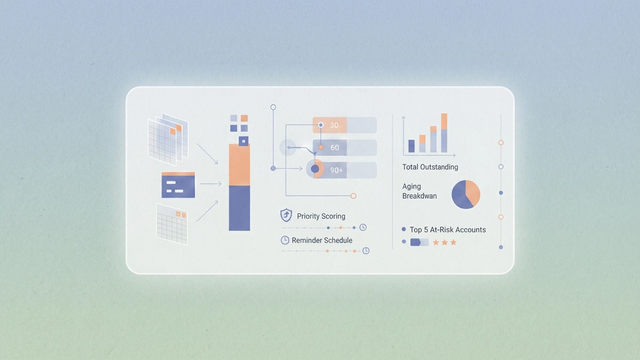
Accounts receivable tracking: invoice to dashboard
Master AR tracking. Flexible solution: spreadsheet ease, Python automation for accurate aging, priority scoring, & dynamic dashboards.

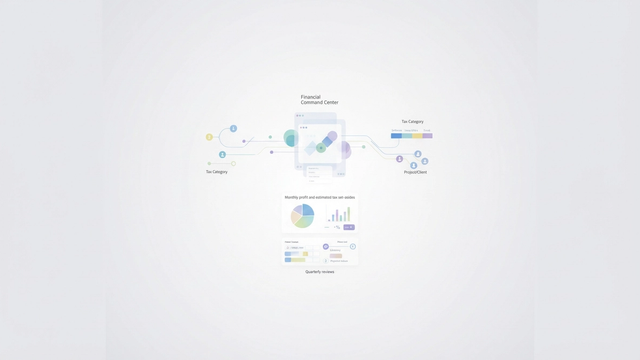
Tax analysis: decomposing multi-year tax liability
Transform your tax analysis from compliance to strategy. Learn to decompose multi-year tax liability with code, visualize insights, and advise clients effectively.

California itemized deductions: compare standard vs. itemized
Discover how to calculate California itemized deductions, understand state-specific rules, and compare standard vs. itemized options for accuracy.
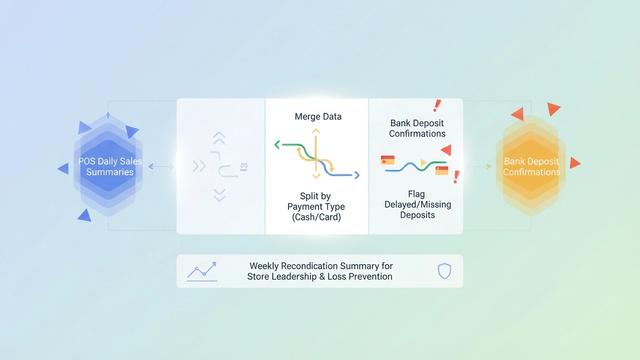
Retail deposit log: daily sales reconciliation & loss prevention
Optimize retail cash management with a dynamic deposit log. Automate sales reconciliation, flag discrepancies, and prevent revenue loss effectively.

Reduce taxable income: self-employed tax planning & deductions
Self-employed? Reduce taxable income with smart planning. Explore deductions, retirement contributions, and scenario modeling to optimize your tax bill.
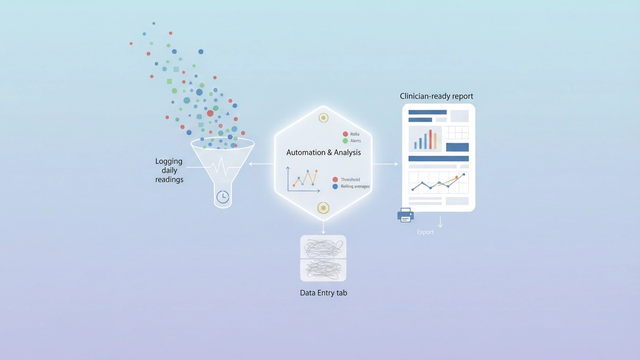
Blood pressure log: track, analyze, and share your readings
Get dynamic insights from your blood pressure log. Easily track, analyze trends, and generate clinician-ready reports for proactive health management.

Travel & expense data analytics: drive savings & compliance
Gain control over T&E spend using travel and expense data analytics. Unify disparate data sources to uncover savings, improve compliance, and optimize operations.
Expense and income tracker for freelancers: profit & tax
Streamline your freelance finances with an automated expense and income tracker. Consolidate data, categorize for taxes, and calculate real-time profit.

Travel expense report: automating receipts, FX, & project allocation
Streamline travel expense reports. Automate receipts, FX, and project allocation with a programmable spreadsheet for accuracy & efficiency.

Tracking crypto transactions: tax basis & reporting
Track crypto transactions for tax compliance. Understand tax basis, accounting methods (FIFO, HIFO), and create auditable data for accurate reporting.

Capital expense report: track assets, depreciation & audit prep
Streamline your capital expense report process. Track assets, calculate depreciation, and prepare for audits efficiently by moving beyond static spreadsheets.

AI budget generator: 12-month budgeting & cash runway
Discover how an AI budget generator transforms financial planning for startups. Automate 12-month budgeting, project cash runway, and build dynamic scenarios.

Month end reconciliation: a complete workflow guide
Optimize month-end reconciliation with this guide. Learn to automate the process using code-powered spreadsheets for an efficient, audit-proof financial close.

Reconcile intercompany transactions: spot & fix mismatches
Learn how to reconcile intercompany transactions with a modern workflow to spot and fix mismatches, eliminate manual errors, and streamline your financial close.

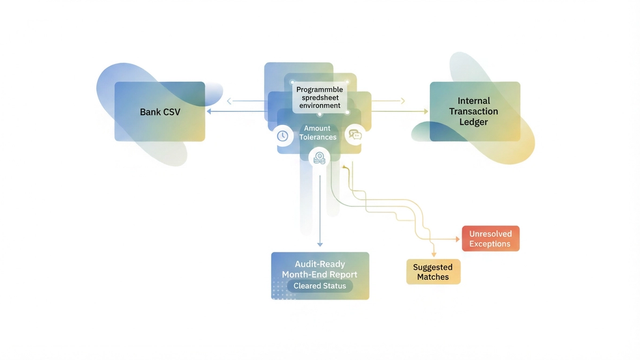
Financial reconciliation tools: automate your workflow
Discover modern financial reconciliation tools that automate your workflow. Streamline data cleaning, logic, and reporting for a faster, transparent month-end close.

Automated budget: real-time tracking, alerts & reports
Transform your finance with an automated budget. Get real-time tracking, intelligent categorization, rolling forecasts, and proactive alerts to stop overruns.

Tax reconciliation: consolidating data & explaining variances for modern accountants
Modern accountants master tax reconciliation. Automate data ingestion, identify discrepancies, & create dynamic, audit-ready variance analysis workflows.
Automated bank reconciliation: simplify monthly close
Streamline your month-end close with automated bank reconciliation. Eliminate manual errors, improve accuracy, and gain transparency in financial reporting.
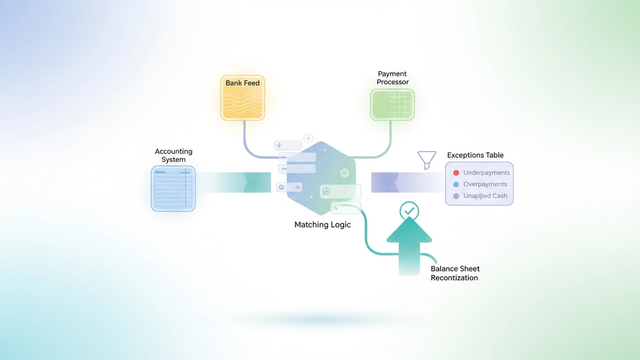
Accounts receivable reconciliation: resolve payments & clean AR
Optimize AR reconciliation. Automate payment matching, resolve unapplied cash, and clean your balance sheet with efficient workflows.

Microfinance lending: building a dynamic financial forecasting model
Create a dynamic financial forecasting model for microfinance. Manage hybrid revenue, automate 3-statement outputs, and enable robust scenario analysis.

Urban infrastructure upgrades: parking system cost assessment
Dynamic financial modeling for urban infrastructure upgrades. Build flexible cost assessments for parking systems, managing CapEx, OpEx, and ROI.

Best financial calculators for mortgage planning & projections: building custom models
Struggling with mortgage planning calculators? Custom, programmable models offer the depth, accuracy, and transparency needed for complex client scenarios.

Comparable company analysis: a modern investor’s workflow
Master comparable company analysis with a modern workflow. Automate data, select peers precisely, and generate dynamic valuations for informed investment decisions.

Debt snowball tracker: optimize debt & cash flow
Beyond basic debt snowball trackers, learn how to optimize debt payoff and maintain cash flow. Build a dynamic model to eliminate debt safely.

Retail product sourcing: data-driven price comparison
Optimize retail product sourcing with data-driven price comparison. Overcome messy supplier data, analyze prices, and find the cheapest inventory sources fast.

Sports facility booking system: financial feasibility study
Financial feasibility study for sports facility booking systems. Model revenue, costs, & profitability with modern tools for clear insights, beyond spreadsheets.

Church attendance tracking software: building the dashboard your board needs
Move past basic church attendance reports. Build custom, board-ready dashboards for deep insights & strategic decisions.

Modern patient tracker: dynamic data management & analytics
Build a dynamic patient tracker to automate data consolidation, ensure accuracy, and create interactive dashboards for healthcare. Ditch spreadsheets.

Pto tracker: simplify employee leave calculation & reporting
Learn how a custom pto tracker simplifies employee leave calculation and reporting. Avoid common spreadsheet errors, ensure compliance, and save costs.

Building a personal productivity spreadsheet
Build a dynamic personal productivity spreadsheet. Use Python in Quadratic to create an auto-updating habit calendar without manual upkeep.

Vehicle rental management: spreadsheet system for tracking
Build a scalable vehicle rental system using Python spreadsheets. Automate operations, track finances, and visualize fleet performance.

Late-cycle US economy investment strategy: find resilient growth
Master late-cycle US economy investment strategy. Confirm macro trends, rotate to defensive sectors, screen for quality factors.

P&L forecast: developing a 5-year strategic plan for phased expansion
Build a dynamic P&L forecast for phased market expansion. Use driver-based models for robust 5-year strategic planning & investor readiness.

Last mile delivery logistics: trip characteristics analysis
Boost last mile delivery efficiency. Analyze trip data to overcome aggregation traps, gain accurate insights, control costs, and improve operations.

Bitcoin mining cost: calculate your true profit
Master your bitcoin mining cost. Learn to build a dynamic model that calculates true profit, breakeven price, and manages risks with real-time data.

Integer linear programming: solve & validate optimization models
Define, solve, and validate integer linear programming models with a hybrid spreadsheet-code workflow. Get transparency, auditability, scenario planning.

Negatively correlated stocks: build resilient portfolios
Learn to identify negatively correlated stocks for resilient portfolios. Use dynamic analysis to truly diversify investments and navigate changing market conditions.

Build discounted cash flow models for equity valuation
Discover how to build dynamic discounted cash flow models for accurate equity valuation. Automate data, project FCF, and calculate WACC efficiently.

Heavy equipment catalog: multi-language data enrichment
Manage your heavy equipment catalog effectively. Learn how to automate multi-language data enrichment, categorization, and formatting for global procurement teams.

Invoice data capture: extract & consolidate PDF billing data
Streamline invoice data capture with transparent Python tools. Automate PDF extraction, apply custom logic (redaction), and ensure auditability for finance.

Soccer performance tracker: spreadsheet analysis functions
Analyze soccer performance data for insights. Use spreadsheet functions (COUNTIF, IF, XLOOKUP) to analyze player metrics, grade performance, & guide coaches.

Asset acquisition: build a robust financial model in excel (and beyond)
Learn to build robust, transparent financial models for asset acquisition. Understand deal structures, inputs, scenarios, and valuation metrics with modern tools.

Customer loyalty analysis: drivers, statistics, & reporting
Perform customer loyalty analysis with T-tests, Chi-square, ANOVA. Uncover retention & spending drivers in hospitality data.

Live program management office dashboard for events
Modern PMO uses live dashboards & automation to eliminate manual reporting, gain real-time insights, and ensure strategic oversight.

NBA DFS projections: crafting accurate player values
Learn to build accurate NBA DFS projections with an automated, transparent model. Gain an edge by customizing data, finding value, and leveraging ownership.

Automate client billing: how to extract and clean PDF data in quadratic
Automate client billing data extraction from PDFs with Quadratic. Clean messy docs, handle redactions, format data for accurate, secure invoicing.

Student performance dashboard: automate annual summary reports
Streamline annual student performance dashboard reporting. Discover how to automate data consolidation, eliminate errors, and generate live summary reports easily.

Key economic growth indicators: impact on equity valuation
Understand how key economic growth indicators like GDP, CPI, and interest rates impact equity valuation. Learn to integrate live data for dynamic investment analysis

Macroeconomic analysis: top-down tech stock strategy
Master macroeconomic analysis for tech stock investing. Build dynamic top-down models in a unified workflow, transforming raw data into investment insights.

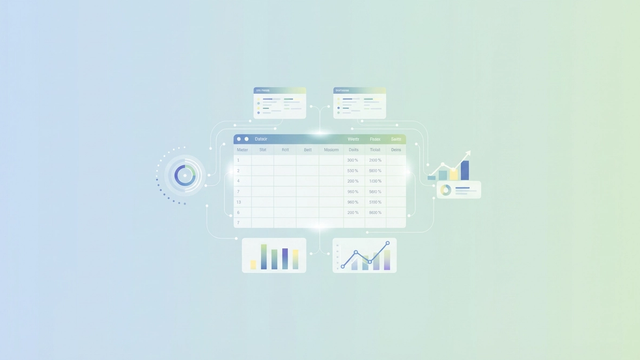
Employee productivity metrics: quarterly analysis & trends
For FP&A, unify employee productivity metrics by correlating monthly operational data with quarterly financials. Get accurate insights for strategic decision-making.

Small business operations: build your integrated spreadsheet system
Transform your small business operations with an integrated spreadsheet system. Centralize data, automate workflows, and gain real-time insights for efficient growth

Hydraulic calculations for irrigation design: a modern approach
Perform precise hydraulic calculations for irrigation design using Excel & Python. Optimize systems, prevent errors, and ensure water uniformity.

Botanical nomenclature: curating plant synonyms for data
Automate plant synonym lookup, data cleaning, and source validation for accurate, compliant taxonomic data management and research.

CO2 emission reporting: data visualization for non-experts
Master CO2 emission reporting for non-experts. Data visualization & narrative unify analysis, making sustainability reports actionable for stakeholders.

Tax deduction of medical expenses: compile, calculate & submit
Learn how to calculate the tax deduction of medical expenses. Understand IRS rules, eligibility, and the 7.5% AGI threshold for itemizing deductions.

Split-half reliability: evaluate survey scale consistency
Split-half reliability assesses survey scale consistency. Learn its calculation via correlation & Spearman-Brown, with a transparent Python workflow.

Farm inventory management software: organize & standardize seed data
Clean and standardize messy seed data with farm inventory software. Use Python to automate data cleaning, extract key details, and boost planning accuracy.

Survey data analysis for HR: boost performance & retention
Learn effective survey data analysis methods for HR to turn feedback into actionable insights in a streamlined approach.

Family budget app: detailed monthly & annual tracking
Tired of rigid family budget apps? Learn how to build a flexible, custom budgeting system with detailed monthly & annual tracking using Quadratic's unique platform.

Mastering transaction reconciliation for audit & compliance
Improve your transaction reconciliation process. Build automated, audit-ready workflows with transparent logic to ensure compliance and financial integrity.

Accounts receivable analytics: optimize unpaid order reporting
Optimize cash flow with accounts receivable analytics. Segment paid vs. unpaid orders for accurate financial reporting & proactive risk management.

Panel data econometrics: modeling tech impact on firm value
Master panel data econometrics for empirical research. Learn to structure, model, & visualize data transparently, addressing endogeneity and ensuring reproducibility

Financial valuation: build a multi-method model
Build a dynamic financial valuation model integrating absolute and relative methods. Leverage a unified platform for accurate, real-time investment insights.

FP&A modeling: build robust financial forecasts & scenarios
Transform your FP&A modeling. Build robust financial forecasts, automate data pipelines, and conduct powerful scenario analysis for strategic decisions.

Actuarial models: term life premium & profitability
Modern actuarial models for term life insurance. Python integration boosts transparency, auditability, and efficiency in pricing & profitability analysis.

Hotel market analysis: trends & occupancy statistics
Modernize hotel market analysis with Python in spreadsheets. Clean messy data, handle missing values, and visualize occupancy trends for accurate insights.

Options trading journal: automate profit analysis
Automate options trading journal: track profits, calculate risk, visualize performance. Build a custom, programmable log for smart trading.

Competitive compensation strategy: analyze & optimize pay
Build a robust competitive compensation strategy. Covers data integration, compa-ratio calculation, and visualizing pay discrepancies for talent retention.

Enhance your wellness tracker with a holistic life dashboard
Transform your spreadsheet into a robust wellness tracker. Learn to fix broken formulas, standardize visuals, and create a unified dashboard for health and wealth.

Csat analytics: executive reports for strategic decisions
Master CSAT analytics for executive reports. Learn to clean data, apply weighted logic, and analyze trends to drive strategic decisions for staffing, costs, and risk

HR time and attendance software: simplify contingent attendance
Optimize contingent workforce with custom HR time & attendance software. Avoid rigid systems & manual errors. Flexible, cost-effective solution for complex staffing.

SLA compliance: service performance analysis & reporting
Learn what SLA compliance means, why standard tools fail at scale, and how to accurately analyze & report service performance with large datasets.

Crafting accessible executive dashboards for decision makers
Craft executive dashboards that drive strategic decisions. Move beyond rigid templates to create clear, visually precise data presentations for leadership.

Ecommerce product data management: quality listings via spreadsheets
Manage ecommerce product data. Programmable spreadsheets, Python, & SQL improve data quality, automate cleaning, prevent errors for accurate listings.

Predictive modeling and analytics: a modern spreadsheet workflow
Perform advanced predictive modeling & analytics in your spreadsheet. Bridge data to insights with integrated Python for robust models & visuals.

Weekly feedback analysis with python for dashboards
Automate weekly feedback analysis with Python in spreadsheets. Clean timestamps, extract week numbers, build dashboards for real-time insights.

Analytic hierarchy process: spreadsheet integration for EV selection
Apply AHP for EV fleet selection. This guide shows how Python-integrated spreadsheets automate data ingestion and complex AHP calculations.

Election results analysis: tabular data from electoral PDFs
Streamline election results analysis. Extract and clean tabular data from electoral PDFs using a code-enabled spreadsheet. Automate your workflow.

Heavy metal food analysis: automated data & compliance
Automate heavy metal food analysis workflows for compliance & data integrity. Eliminate manual errors, simplify reporting, get auditable food safety results.

Churn rate vs retention rate: drive subscription strategy with better data
Master churn vs retention rates. Build live, interactive dashboards for real-time insights. Move beyond static reports to boost subscription strategy.

Microplastics analysis for health impact & risk assessment: a modern workflow
Microplastics analysis needs new tools for health impact assessment. Python workflows streamline data integration, cleaning, & risk assessment for rigorous research.

SEO meta tag generator: batch update spreadsheet meta tags
Discover how to use a Python spreadsheet as an seo meta tag generator for bulk updates. Merge, validate, and manage thousands of meta tags reliably.

Readmission analysis: frailty, complications & trends
Perform robust readmission analysis with Quadratic. Overcome data complexity, calculate risk, and gain actionable insights for QI.

Automate vendor payment management for contracts
Automate vendor payments & dynamic contract schedules. Reduce spreadsheet chaos, ensure accuracy, and eliminate manual errors with a flexible system.

Financial stress tests: model savings profitability
Learn how dynamic financial stress tests ensure product profitability. Integrate live data, model scenarios, and analyze vulnerabilities to maintain viability.

ED staffing: optimize capacity & cut wait times
Optimize ED staffing with Python-powered models. Learn to use dynamic data analysis to align capacity with demand, reduce wait times, and improve patient safety.

Balance sheet not balancing? resolve model formula errors.
Balance sheet not balancing? Learn common formula errors and how to diagnose & fix them in your financial models for accuracy.

Portfolio analysis tool: visualize & report investment deals
Discover a flexible portfolio analysis tool for investment deals. Use SQL for transparent filtering & Python for dynamic visualizations on an infinite canvas.

Material composition analysis: visualize & quantify impact
Streamline material composition analysis by combining spreadsheet familiarity with Python's power. Normalize data, quantify impact, and visualize trends effectively.

Horse racing data analytics: analyze finishes & costs with pivot tables
Improve horse racing data analytics with interactive tools. Analyze race finishes & costs dynamically using Python spreadsheets for smarter betting.
AI in clinical data management: analysis & prediction
AI in clinical data management boosts research reproducibility, data integrity, and predictive modeling. Move beyond spreadsheets to powerful analytics.

P&L analysis: track & forecast project profitability
Master P&L analysis to track & forecast project profitability. Move beyond fragile spreadsheets with code-enabled modeling for dynamic insights.

Maximize bakery profit margin: costing & pricing strategy
Use dynamic financial models to uncover hidden costs & optimize B2B/B2C pricing for smarter small business decisions.

Last mile delivery logistics: accurate trip data summaries
Learn to accurately summarize last mile delivery logistics trip data. Overcome spreadsheet limitations like associated value errors for better analysis & compliance.
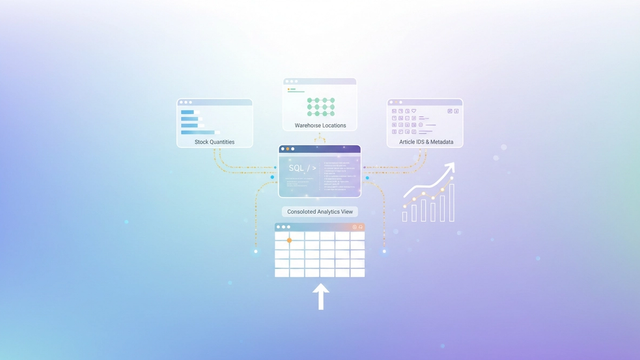
Inventory analytics: multi-location stock management in spreadsheets
Optimize multi-location stock management with inventory analytics. Learn to use SQL & Python in spreadsheets for robust data consolidation and insights.

Reseller inventory tracker: automate reports & track profits
Learn how to build a flexible reseller inventory tracker using Python & SQL. Automate partner payouts, visualize sales data, and simplify monthly reporting.

Master product catalog management: clean, validate, organize
Master product catalog management: clean, validate, and organize product data with automated workflows. Eliminate errors and streamline your catalog.

Procurement process assessment: extract invoice data from PDFs
Improve your procurement process assessment by automating invoice data extraction from PDFs. Eliminate manual entry, reduce errors, and gain actionable insights.

Data analytics in insurance: ensuring data integrity & reporting
Learn how data analytics in insurance transforms financial reporting. Ensure data integrity, automate validation, and generate accurate reports.

Video marketing analytics: building a scalable spreadsheet KPI tracking system
Master video marketing analytics with a robust KPI system. Integrate operational & performance data using Python spreadsheets for scalable, accurate reports.

Cannabis retail operations: profitability & pricing strategy
Maximize cannabis retail profits. Learn how dynamic COGS modeling & financial analytics protect margins, optimize pricing, and drive growth despite 280E.

Build a student performance dashboard: grades & tracking
Build a dynamic student performance dashboard. Track grades, visualize student health with RAG indicators, and automate intervention planning.

Create an automated daily habit tracker dashboard
Learn how to create an automated daily habit tracker dashboard using Python in a spreadsheet. Get fresh daily tabs, aggregate data, and visualize progress.

Construction contract review: identify & mitigate risks with a dynamic system
Transform construction contract review from static to dynamic. Learn to identify & mitigate financial risks with an ongoing system, protecting margins effectively.

Crypto visualization: designing clear financial insights
Clear crypto visualization insights. Analyze complex digital asset data with custom charts & interactive elements. Design & code for financial stories.

Fleet performance metrics: segmenting & visualizing driver tiers
Uncover true operational efficiency with fleet performance metrics. Learn to segment driver tiers using RPM to move beyond averages & identify top performers.

OCR financial statements: digitize & format for analysis
Automate OCR financial statements. Go beyond raw extraction to programmatically format and analyze data in board-ready reports, saving hours of manual cleanup.

Telecom data analysis for informed network decisions
Transform your telecom data analysis. Learn how to automate network health reporting, improve accuracy, and gain auditable insights for informed network decisions.

Stock index comparison: calculate & format returns
Master stock index comparison. Get a reliable workflow for calculating & formatting returns, eliminating manual errors in financial analysis.

Budget format for an event: fix errors, boost profit
Transform event budgets from fragile spreadsheets to dynamic models. Fix errors, centralize logic, and use scenario planning to boost profitability.

Build a logistics KPI dashboard for supply chain insights
Learn to build a dynamic logistics KPI dashboard that automates data cleaning and calculates fill rates, delays, and on-time delivery for supply chain insights.
Weighted average process costing: calculations & journal entries
Learn weighted average process costing calculations & journal entries. Discover steps, key differences from FIFO, and how to automate for efficient cost accounting.

Loan portfolio management: simulate & optimize profit
Master loan portfolio management. Use Python, predictive analytics, & Monte Carlo simulations to optimize profit by finding the ideal credit score cutoff.

Survival analysis in Excel 365: deconvolution models
Perform rigorous survival analysis with deconvolution models using Python/R in Excel 365. Get accurate, interactive results for stakeholders.

Financial localization: mastering local compliance
Automate financial localization, compliance, and reporting. Programmable tools reduce errors, streamline global financial statements for accuracy and trust.

Corporate travel data analytics: from PDFs to expense insights
Transform messy corporate travel data into actionable insights. Automate expense tracking, visualize spend, and make smarter decisions with data analytics.

Best product analytics tools for adoption tracking
Learn the best product analytics tools for adoption tracking. Manage messy data, define customer segments, track complex migrations with Quadratic for insights.
Reduce advertising cost of sales: daily optimization
Reduce ACoS with a daily optimization workflow. Overcome data challenges, build a proactive engine, and achieve efficient ad spend.

Strategic labor cost planning for financial sustainability
Learn strategic labor cost planning for financial sustainability. Move beyond lump-sum estimates to granular, role-based models for accurate forecasting and growth.

Startup financial model: plan, project, fund your venture
Master your startup financial model with driver-based planning. Create dynamic projections, manage cash flow, and confidently secure funding for venture.
Tools to track subcontractor performance: building a dashboard & metrics system
Track subcontractor performance with automated dashboards. Monitor key metrics, get proactive risk alerts, and move beyond manual reports.

Mastering product profitability analysis for complex projects
Master product profitability analysis for complex projects. Discover dynamic modeling to handle phased changes, automate data, and gain accurate insights.

CPU cooler benchmarks: crafting clear video charts with quadratic
Create clear, broadcast-ready cpu cooler benchmarks charts for video reviews with Quadratic. Streamline data analysis and visualization using Python and SQL.

Aircraft values: building robust valuation models
Learn to build robust aircraft values models beyond static spreadsheets. Integrate live data, Python, and SQL for transparent, auditable, and dynamic valuations.

Monte carlo simulation for financial risk analysis & projections
Learn Monte Carlo simulation for financial risk analysis & projections. Discover benefits, challenges, and how Quadratic streamlines robust simulations.

Fashion color analysis for product line optimization
Leverage data-driven fashion color analysis to optimize product lines. Clean data, score performance, and visualize assortments for better inventory decisions.

Employee attendance sheet: daily to monthly summaries
Streamline employee attendance. Automate daily logs to dynamic monthly summaries, eliminating manual errors with SQL & Python.

Building a dynamic current expected credit loss model with macro analysis
Build a dynamic CECL model using live macroeconomic data. Get robust, auditable risk analysis and overcome spreadsheet limitations.

Utility consumption reporting: master data consolidation
Learn to master utility consumption reporting by consolidating fragmented data from diverse sources and analyzing the data with Quadratic.

Supply chain analytics course guide: mastering strategic data modeling
Master supply chain analytics course projects with our guide. Learn data modeling workflow, from cleaning to dashboards, bridging theory and practice.